Saturday, October 30, 2021

Normalized Statis-Pro Baseball Cards for 1968 and 1981

Normalized Statis-Pro Baseball Cards for 1968 and 1981 


 During the last two-plus years I didn’t just normalize the 1972 season, I also created normalized cards for 1968 and 1981, seasons I had posted earlier. The seasons are instructive as to the model and how it changes teams from different offensive contexts. 


 Below I’ve crafted a few charts that show how different seasons are modeled. The very strong pitching seasons of 1968 and the 1972AL land more results on pitchers cards, and this change from 50/50 results in a higher offensive multiplier for offensive cards. In contrast 1981 has less of this effect, and a modern season, with its “three outcomes” creates a higher offensive context with its emphasis on power and walks. The multiplier adds batting average, on base percentage, and slugging to batters cards in pitching rich seasons. 

 Figure 1: Summary Charts
 The higher offensive context of 2021 will result in fewer hits and homeruns on batters cards, since pitchers now control extra base hits comparatively worse. A typical 1981 AL Batter will now have 19.88 hits, up from 19.04 and 2.9 BB, down from 3.1. While the starting point for 1981 AL batters and 1968 AL batters for homeruns is very similar, after adjustment the 1968 AL will have more power. The 2021 AL, with its emphasis on power throughout the lineup and walks, will wind up with fewer hits on batters cards but more of them will be doubles and homeruns. 2021 AL batters will also walk more and get hit by pitched ball more. This is how you have a five home run games with an ending score of 6-2. The important point is 1968 teams will still not hit better than those from 1972, 1981, or 2021. But the difference will now be less facing those lineups, and also partly made up by their pitchers. 

Figure 2: Offense Comparisons
 If a standard carding pitcher retains control 2-6,11,12, a 1968 pitcher retains control 2-6,10,12 and a 2021 pitcher retains control 2-6,11 (More or less). The differences are subtle but over a season having your pitchers consistently prevent extra base hits adds up. Figure 3 below shows how pitchers are affected by their context. In general some 2-5 pitchers will move up to 2-6, some pitchers will move up to 2-7, and there will be more 2-8 and 2-9 pitchers. 

 Figure 3: Pitching Comparison

The addition of more hits to 1968 and 1972 batters cards mean these hits also come off of the pitchers cards. A typical 1968 pitcher will have around a hit to a hit and a half taken off of their card, while teams from high run contexts would see a similar number of hits added.  The net effect, again, is to bring these teams closer together when they play each other. 

Sunday, September 12, 2021

“The Swingin’ A’s” - 1972 Season Cards for Statis-Pro Baseball


(Carded Teams from the 1972 season of Major League Baseball) 


Cards by Standard Methods:


“I'll always maintain that the best Series I was ever involved in was the 1972 World Series against Oakland. That's because those were the two of the finest ball clubs to go against each other that you'll ever see in I don't know how long.”


-Sparky Anderson


Other Links to Statis-Pro Baseball Content:


 It's been two and a half years since my realization that the 1972 World Series was unplayable if carded by normal means. The 1972 Reds came from an offensive context almost half of a run stronger than the 1972 Oakland As. While some of this difference would be accurately reflected in the pitching cards, in general any Series involving the two teams would not be competitive if based on the normal carding.  So I’ve also prepared 1972 using a normalized method, just as I did for 1968 and 1981. 


 I've discussed the new normalization approach in a previous post; the last two and a half years was spent actually testing it. I carded in bits and pieces both the most run starved and run scoring seasonal environments in both leagues. It takes so much effort to card and publish a season that it seemed a waste of time to do the full approach for 1972 unless I could be sure that this approach was going to work. But I tested it, and I'm now confident that it does indeed work, and so I'm posting both the 1972 American and National Leagues carded using both methods, and I'll let gamers judge the results. 


 In the American League, Baltimore once again has the best pitching staff, but an uneven lineup (missing Frank Robinson, traded to the Dodgers) meant they can't pull away from Detroit or Boston. The Sox can hit, as every position but first has solid hitters, and the lineup features a hot newcomer, catcher Carlton Fisk, who would make Boston a contender for most of the next decade. The real dilemma for the Boston manager is what to do with swingman Luis Tiant, a Cy capable starter or reliever on a team that needs both. The Yankees featured center fielder Bobby Murcer and catcher Thurman Munson, and at one point they made a charge behind Sparky Lyle and their great bullpen, but they lacked deep enough starting pitching to contend. Cleveland had one big horse - Cy Young Award winner Gaylord Perry who finished with a 1.92 ERA and won 24 games for an otherwise bad team. Milwaukee was led by slugging first baseman George Scott and outfielder John Briggs. 


 The White Sox used 49 starts from ace Wilbur Wood to run essentially a three man starting rotation, with Stan Bahnsen and Tom Bradley filling in the other spots.  Wood, a knuckleballer, threw a league high 367 IP in 49 starts and won 24 games.  The Sox were led on offense by first baseman Dick Allen, who batted .308 and smashed 37 HRs and 113 RBI.  Second baseman Rob Carew batted .318 for a Twins team that had a nice lineup, but a bit of a power outage, as they struck only 93 homeruns.  The Twins did have four great pitchers in Bert Blyleven, Jim Perry, Dick Woodson, and Jim Kaat.  Kaat, 10-2 through 15 starts on July 2, broke his pitching hand sliding at Comiskey Park and was out for the year, at the time he was also having his best year at the dish, batting .289 with two home runs and five extra base hits in 49 plate appearances.


 In spite of hitting the fewest homeruns, Kansas City had one of the best offenses in the AL in 1972, led by first baseman John Mayberry and speedsters shortstop Freddie Patek and outfielder Amos Otis.  They had the highest batting average in the league and highest on base percentage, and they finished second in the league in doubles.  The Angels had a rotation of Nolan Ryan, Clyde Wright and Rudy May, and led the AL in strikeouts. Ryan threw 9 shutouts with 329 strikeouts, but their lineup scored the least runs in the league.  Texas, still suffering from the loss of the left side of their infield in the Denny McLain trade, was so bad they had a book written about this season. 


 Billy Martin did a great job of getting the most out of the aging Tiger lineup, managing platoons out of the three outfield and second base positions and creating a third and fourth starter out of journeymen swingmen. The Tigers had superb fielders at shortstop in Eddie Brinkman, third baseman Aurelio Rodriguez, and outfielder Mickey Stanley. The lack of pitching depth past Lolich and Coleman almost cost them the flag, but Martin righted the ship by obtaining Woodie Fryman in a trade right as third starter Tom Timmerman was starting to fade. Fryman was the Doyle Alexander of 1972, finishing 10-3 with a 2.06 ERA. The Tigers won the East on the final weekend of the season.


 The A’s weren’t quite the finished product of their 1973 team, batting only .240 while leading the league in homers behind their troika of outfielders Reggie Jackson and Joe Rudi, and first baseman Mike Epstein.  What the A’s had going for them was a staff that could throw a shutout every night in starters Catfish Hunter, Ken Holtzman, and Blue Moon Odom, backed up by a deep and talented bullpen featuring Horacio Pina, Darold Knowles, Bob Locker, and Rollie Fingers.  This pitching depth was the difference maker in both post season series, and for the three years between 1972 and 1974 they would be extended at times, but they would not break. They were able to hold off the game Tigers in a hard fought five game AL Championship Series in part because they made the plays and pitches the Tigers didn’t. 


 In the National League the Reds fielded a tremendous lineup led by MVP catcher Johnny Bench, second baseman Joe Morgan, and outfielder Pete Rose, as well as a talented pitching staff.  They prevailed in five games in the NL Championship Series over the defending champion Pirates, who were led by first baseman Willie Stargell, catcher Manny Sanguillen and outfielder Roberto Clemente, playing in his final year before his untimely death.  Trailing 3-2 in the bottom of the ninth against the NL’s top reliever, palm baller Dave Guisti, Bench launched a long home run to tie the game, and Bob Moose wild pitched in the winning run.  In spite of their great teams in the middle of the decade, Pittsburgh would not break through to the World Series until 1979.


 The 1972 Cubs finished second in the East as the last squad of their Golden Era.  Leo Durocher, who had built the team, was fired mid year and the team never found the footing to keep up with the Pirates.  Jim Hickman had taken over Ernie Bank’s place at first but the rest of the Cubs great late sixties infield of Santo, Kessinger, Beckert and Hundley were all older and nearing the end.  Billy Williams had perhaps his best year with 37 HR and 122 RBIs, and the team had five good starters including Ferguson Jenkins, Burt Hooton and Milt Pappas, but an uneven bullpen kept them from breaking through.  The Mets got great years from pitcher Tom Seaver and Rookie of the Year Jon Matlack, as well as bullpen ace Tug McGraw, but the lineup suffered from injuries and poor hitting as the Mets slipped to third place.  The Cards got good years from aging veterans Bib Gibson, who won 19 games at the age of 36, outfielder Lou Brock, who hit .311 and stole 63 bases at 33, and young catcher Ted Simmons, who batted .303 and drove in 96 runs, but they no longer had the pitching depth to take advantage of their team speed and defense. The Expos had a couple of nice starters in Bill Stoneman and Mike Torrez, and a great relief man in Mike Marshall who won 14 games and saved another 18 out of the bullpen. Shortstop Larry Bowa and outfielder Greg Luzinski were the bright spots in the lineup for the last place Phillies, but Steve Carlton turned in a season for the ages, every bit as impressive as Denny McLain’s 1968 total of 31 wins.  Carlton posted a 1.97 ERA and 30 CG in 41 starts, finishing 27-10 in 346 innings for a last place team that only won 59 games.  5-6 at the end of May, Lefty then won fifteen consecutive decisions up to August 17, and for the season he threw 8 shutouts and struck out 310 batters for good measure. Easily winning the Cy Young Award, this effort is probably among the top two dozen seasons in baseball history. 


 During their time in the Astrodome, from 1965 to 1999, the Houston Astros led the NL in runs scored exactly twice- 1998, the Randy Johnson team, with Biggio and Bagwell leading a posse of good hitters to 874 tallies, and this year, 1972, with a measly 708 runs. Despite the paltry total this was the only Astro team to lead all of baseball in runs scored in spite of the Astrodome, and they did it with a deep and talented lineup, with outfielders Cesar Ceceno, Jimmy Wynn, and Bob Watson, third baseman Doug Rader, and first baseman Lee May all contributing at least 16 homers and 82 RBIs.  Unfortunately the pitching staff beyond Larry Dierker and Don Wilson lacked depth as the Astros finished tenth in ERA.  The opposite problem existed in Los Angeles, where Don Sutton, Claude Osteen and Tommy John anchored the league’s best staff, but nobody, even Frank Robinson, could top 20 HRs.  The Dodgers did build for the future though, moving outfielder Bill Russell to shortstop for good following Maury Wills’ holdout, and finding a gem in utility man and part timer Steve Garvey.


 Atlanta’s catcher Earl Williams, outfielders Dusty Baker and Ralph Garr, and third baseman Darrell Evans, sound batters all, joined first baseman Hank Aaron on his match to immortality.  The Braves had a nice lineup but finished dead last in NL ERA despite Phil Niekro’s 16 wins.  San Francisco finished 9th in ERA and 10th in fielding to squander great seasons from outfielder Bobby Bonds, who smacked 26 HRs and stole 44 bases, and All-Star shortstop Chris Speier.  Dan Diego first basemen Nate Colbert clubbed 38 homeruns and drove in 112 for the otherwise moribund Padres, who featured the Major’s only 20 game loser in Steve Arlin, who finished 10-21 I spite of a decent 3.60 ERA.


 The 1972 World Series is still considered a 7 game classic, and more than once Sparky Anderson has said his greatest regret was this Series loss. Both teams were deep and talented, but the A’s were missing outfielder Reggie Jackson who was injured in the last game of the ALCS.  Six of the seven games were settled by one run, putting pressure on the game’s best bullpens, and in back to back games first the Reds bullpen, in Game 4, and then the Oakland bullpen, in Game 5, handed the enemy a win in the last licks. But the Reds loss in Game 4, where they allowed two runs in the bottom of the ninth to lose 3-2 after taking a 2-1 lead in the top of the 8th, was the most damaging loss.  It left them trailing 3–1 in games, and in the seventh game, while they had the tying run on base and Pete Rose at the plate, Rollie Fingers slammed the door.  Fingers pitched in six games, with a win, a loss and four saves, and a little known backup catcher named Gene  Tenace hit .348 with four home runs, a double and 9 RBIs. 


 The Normalized cards for both leagues I think give you the real picture for these teams- the A’s depth and power and pitching, and the Reds multiple styles of offense, speed, power and batting. Enjoy these cards.  


1977 is next, “The Bronx is Burning”


Monday, May 20, 2019

Normalization Of Statis-Pro Baseball Seasons (Featuring Carded Teams from the 1972 World Series)


On Normalization of Statis-Pro Baseball Seasons

--Featuring the 1972 World Series teams, the Oakland A’s and the Cincinnati Reds

(This is either brilliant or the stupidest idea I’ve ever had with this game.  It took me only forty years to figure this out.  People will either demand more of this or never play it, and I have no idea which outcome will win.)

Typically Carded SPBB Versions, for Comparison:


and here's normalized Versions:


72 Cincinnati, Normalized

72 Oakland, Normalized


I first received a Statis-Pro Baseball season in early 1979, the 1978 carded season.  It was the Bronx-Zoo era Yankees and Red Sox, Jim Rice and Ron Guidry and Rod Carew and Jason Thompson – I was Tiger fan.  The fringe players had the last Mark Fidrych card, a 2-8 wonder off limited data, and it was great fun pitching The Bird in front of Steve Kemp and Lou Whitaker and Alan Trammell.  I had a friend who loved the 1978 Astros and 1978 Dodgers – we practically wore those cards out.

The next baseball year featured the fantastic World Series between the 1979 Orioles- one of the most underrated teams of that era, and the “We Are Family” Stargell-led Pirates.  There was another great National League team, the Montreal Expos, and the Tigers had two new great new pitchers, Jack Morris and Dan Petry. I looked forward to those 1979 cards.

The 1979 season on the surface was wonderful.  The teams were even more vibrant than the 1978 cards.  That was actually the problem.  The 1978 AL ERA was 3.76, but in 1979 the AL ERA was 4.22.  The National League had a smaller differential (3.56 to 3.73) but it was still clear that the season was made up of teams that were on the whole more robust offensively than the season before them.  Jim Rice in 1979 had a similar season IRL to his wondrous 1978 MVP year; yet he was only the fourth best hitter in the 1979 AL.  Fred Lynn, his teammate, had a better Statis-Pro card than 1978 Rice in every way. 

The game was designed around static offensive cards, with the pitchers designed to “average” allowing batting card results half the time.  Within the season pitchers were still rated against each other.  There was no normalization to surrounding seasons or even the other league.  The latter made some sense, the offensive contexts were different between the AL and NL due to the DH.  But it was pretty clear to me a 3.60 ERA in the 1978 AL was rated as a 2-6 pitcher, while the same ERA in 1979 was now a 2-7 pitcher.  This was a big deal, because the game had another flaw, pitchers with 2-6 and 2-5 cards were not properly rated for hits allowed, which required some manipulation in game results (the Shutout Good Stuff PB table) to partially correct.  Simply put, as carded, 1978 was not competitive with 1979.   

These factors particularly vexed me because the only thing better than getting cards from Avalon Hill was making your own teams.  I bought the Sporting News Guide for 1968 (still have it) and rated my own teams using long division and index cards.  The 1968 Tigers were one of my favorite teams but I also carded several others.  Once again, the problem – 1968 pitchers, not matter how low their ERAs, would ‘average’ a PB of 2-6.5, 18/36 chances or 50%.  While their hits per inning were lower, a 2.87 ERA pitcher in 1968 would be a 2-6 but that same ERA would push a 2-8 rating in the 1979 AL.  Meanwhile the Tigers still had the batting cards of a team that hit .235. 

This normalization error was not present for the most part, in Strat-O-Matic, where the batting cards for a low run context would reflect the value of good hitters in that context, while pitchers would also perform as desired.  Within a season, in particular a World Series, Statis-Pro Baseball could give a gamer a great feel, but if you wanted to play across eras, only Strat-O-Matic could really meet the need.

The Legend of David C. LeSueur

There were enough problems with Statis-Pro Baseball that I left playing it for awhile.  In the summer of 1981, the 1980 cardset came out, and while batters cards were still static – a .400 card in 1980 would look the same as one in 1968 – pitchers cards, in particular 2-6 and 2-5 pitchers received a makeover.  A gamer by the name of David C. LeSueur published how to correct the game’s main flaw, the extra hits lower tier pitchers had in early carded seasons, but should not have received.  He did this by calculating the hits, walks, etc of the batters they faced, adjusting for the different chances to arrive on those hitter cards based the pitcher’s PB results.  It was flat-out brilliant writing, one of those articles that you have to read twice because the implications were huge.

What’s more he published this in All-Star Replay, which meant if you received that issue you received the means to calculate for yourself the pitching fixes you needed to at least compute a season with internal consistency.  It was a true game changer, now a pitcher could be what I call a ‘good 2-6’, with low (h+w)/ip but a higher ERA, and he would not be rendered worthless by the game’s carding system.  We all owed a debt to him.   Later, when I found myself on a test team with him, I reached out to thank him for the changes he made that brought me back to looking at Statis-Pro Baseball.

(All Star Replay was a gem – in one issue came LeSueur’s work, 1978 Japanese Baseball cards, Secretariat and Man O’ War race cards for Win, Place and Show, a review of the year’s welterweights including Tommy Hearns, Pipino Cuevas, Roberto Duran, and Sugar Ray Leonard for Title Bout, the 1979-80 NBA semifinal teams for Basketball Strategy, and yet another solitaire system for Paydirt.  This was classic written 1970’s gaming content.)  

But one thing bothered me.  Mr. LeSeuer’s system, as elegant and consistent as it was, still did not solve the problem of the static batters cards.  If there was one thing that Strat-O-Matic taught me, it was a .350 batter’s card in the 1930 AL would look different than one in 1965.  I chewed on that for four decades.  Sometime in the late Eighties Avalon Hill published a Great Teams Set.  This had teams like the 1986 Mets and 1984 Tigers and 1962 Giants.  I looked at this set with keen interest, because the Game Co had re-carded some teams it had already done.  I wanted to see how this might work. Well, what they did was pick teams from very similar ERA contexts.  Then they normalized all the pitchers within the set against each other.  The batter’s cards were still very similar in technical construction, functionally the same as they had been before.  Instantly I knew that this was the wrong track.  If you merely made all pitchers below, say a 2.30 ERA in 1968 2-9s so they could play steroid era teams loaded with 2-5 and 2-6 pitchers, you might get some results which would match up correctly but any internal consistency and balance within a season would be lost. 

Those 1968 batters cards still need to face those 1968 pitchers, and they would now fare even more poorly, while 1997 hitters would crush their lower PB same season pitching cousins.  The historic problem with static batter’s cards would just move to the pitcher’s cards.   Pitching seasons would be stronger with this model, Instead of strong offensive seasons having the edge.  I knew the answer was in remaking the batter’s cards but I wasn’t sure how.  Somehow hits from the pitchers cards needed to move to the batters in 1968, but from the batters to the pitchers in, say 2001.  I thought briefly about using log five to establish a ‘baseline’ offensive season and then remaking the cards for each season to conform to that model. But that still left the pitching problem unsolved.

Then one morning I woke up, after a night of thinking about the 1972 World Series, with most of the answer.  You would not arbitrarily just make a certain ERA a PB across all seasons.  Instead what you would look at is standardizing a set of ratios of (season era * 100 /individual pitcher era).  Typically a ratio of 180 or 190 would be a 2-9 in most seasons, 135-140 a 2-8, 107 or so a 2-7, and 80 a 2-6. A pitcher with an ERA of 1.96 in 1968 (ratio 152) is a 2-8 for this reason, while a 2.20 or 2.30 ERA in a modern high ERA season might be a 2-9.  What you want to find out is- if a pitcher has an ERA of 1.96 in the 1968 AL, how should his ratio compare versus the entire AL from, say 1960-2018 (ERA 4.08)? 

I’m going to adapt Log5:

( p A − p A × p B)/
( p A + p B − 2 × p A × p B )

Where A = 2.98 the ERA for 1968, and 4.08 is the average ERA for all seasons.  The numerator is -9.1784 and the denominator -17.2568, so pAB is now 0.531821.  pB is 0.5 – the average season should yield fifty  percent results on batter’s and pitcher cards.   So pA is 0.531821/0.5 which is a dimensionless correction factor, 1.0637.  A 1968 pitcher should be 1.0637 better than the norm, 1.0.   But what does this mean?  You don’t just divide his ERA by 1.0637.  You must look at those seasonERA/pitcherERA cutoff ratios.

So now what you can do is find the cutoff ratios for 1968 – the last pitcher’s ratio in each bucket – and divide by 1.0637 – and that would be the new ratio for that rating.    For instance, Stan Bahnsen’s 2-8 lowest 1968 ERA ratio of 145.4 is corrected (divided by 1.0637) to the new ratio of 135.7 admits upon comparison four new pitchers to the ranks of the 2-8s. And so it goes, until you have calculated the full season. You may need to adjust the ratios a bit for the teams to work within the season, but in the end, the 1968 AL will feature two more 2-6 pitchers, nine more 2-7 pitchers and six more 2-8 pitchers out of 112 total pitchers.  The 2-5 range now starts at an ERA of 3.86 rather than 3.69.  50 percent of all pitchers are now 2-7s or better in this model. We are almost home.


The average 1968 AL pitcher is now a much closer to a 2-7 than if his card were exactly midway between 2-6 and 2-7.  He will have results on his cards about 55.4% of the time, which means all the 1968 batter hits, especially the extra base hits, now need to be bumped up on the batter’s cards by the factor 0.5/ (1-0.554) or 1.121.  Batter’s cards only see results 44.6% of the time, so the hitters must have more singles, doubles, and homeruns than before.  The pitchers now contribute their 11 strikeouts 55.4 percent of the time, so the amount on the batter’s cards needs to reflect this.  Same with walks:

1968 AL STD:                         1968 AL NEW:
1B:  8.79                                    1B: 9.86
2B: 4.10                                      2B: 4.60
3B: 0.74                                      3B: 0.83
HR: 2.42                                      HR: 2.72
K:   10.10                                     K; 10.0
W:  2.52                                      W: 1.98
HBP: 0.93                                    HBP: 1.05

This doesn’t look like much of a change, but this bump adds an extra 13 points of BA, 12 points of OBP, and 30 points of SLG.   1968 is the worst case scenario among teams from the last sixty years.  Most adjustments are much more subtle, more like rounding up or down here or there.  The 1972 AL happens to be the second worst season for offense in the last sixty years.  The 1972 NL is still a strong pitching season, but not as strong comparatively.

That’s adjustments to an average 1968 AL hitter.  But that includes pitchers.  The better the hitter you are, the more this adjustment can help you, which matters if you are, say, Willie Horton.  After correction his homerun numbers rightfully rise to nine homeruns and a carded .307 batting average – Horton was the fourth best hitter in the league among qualifiers at .285.  No longer does the card just reflect hits/ TOT.  It now reflects how he hit in his offensive context.  Hitting 36 HR in 1968, he would hit 41 in a normalized season in 143 games, and 43 against (as an example) 2006 AL pitching in 140 games.   

You can test this, too. Let’s take a cross section of 1968 Tigers.  If we look at their OPS plus from 1968, and then compare what their carded OPS is in terms of OPS+ for seasons that are more normal, like 1977, 1982 and 2011, we should see a similar projected OPS+.  And we do.  Horton would probably project to a 155 or so in a modern season, Northrup 130, Cash maybe a tad low at 127, Kaline, a similar outcome.   None of that troubles me too much, because these results have to be ‘rounded’ into 1/64 values on the batter’s cards.  Some players will round higher, such as Matchick does.  The point is Jim Northrups’ projection from a .264 hitter in a year where the AL batted .230 to a .295 hitter in a more modern AL is perfectly reasonable.  Teams in 1977 (.266), 1982 (.264), and 2011 (.258) hit from 28 to 36 points higher than 1968, and Jim Northrup was 16th among qualifiers in batting average in 1968.  The equivalent hitters in 1977, 1982, and 2011 were Larry Hisle (.302), Fred Lynn (.299), and Derek Jeter (.297) respectively. (These are larger seasons with DHs but you get the rough idea.)   


(It always bugged me that the 2006 Detroit team, carded with Marcus Thames and his nine home run numbers in the static system, was a better slugging team on their cards than the 1968 Tigers.  That result is ludicrous.  1968 Detroit hit 185 homeruns in a season where the team average was 110; they out-homered the second best team by fifty two homeruns. That was, at the time, a top twenty team homerun hitting result in baseball history, 185 home runs- in the Year of the Pitcher.  The 2006 team had 203 home runs in a season where the average team hit 182. Their correction, 0.9471 reflects the fact the batters now get their results 52.8 pct of the time. Once you factor both corrections the 1968 team pulls ahead on pure power, as it should.)

The last piece is those extra hits hitters have (17.99 to 16.05) now have to come from the pitcher’s cards, which they will through the standard LeSueur handling.  In this case, this handling will remove about two hits off the average pitcher.  Not all pitchers are affected the same way – Denny McLain’s card is the exact same in both models, while lesser pitchers, such as Joe Sparma will lose a few hits to account for the fact the average batting card slugs higher. This is as it should be- 1968 pitchers are not ranked against the rest of AL history as an absolute- their PB, or ability to muzzle extra base hits is ranked on a sliding scale. The 1968 AL pitchers are on the balance the best and most extreme example, but a 1987 AL pitcher with a 3.70 ERA will still be a 2-7 based on his relative ratio within his season.  The 1968 Pitcher with a 3.70 ERA is a 2-6, and will consequently face more batter results either when facing his own season or any other within the rating pool.  His card must be adjusted to account for this.          

This is probably tough for some readers to fully grasp – I’ll have to do more explaining. But good cards are worth a dozen paragraphs, and so I’ll give you some examples- the normalized cardings for the 1972 World Series.  Both teams, of course are pre-DH teams, Oakland from a year with a 3.06 ERA, Cincinnati for a year with a 3.45 ERA.  Carded in static fashion Cincinnati would have equivalent pitching and much better hitting, which means they would be a much better team, which was certainly not the case.  Adjusted for their contexts in this new system Cincinnati is a good pitching team with a slightly corrected lineup (factor 1.063), while Oakland has a slightly better staff with a lineup that benefits from even stronger correction (factor 1.108).  Now the Series is a dead heat, with the top of Cincinnati’s mighty lineup squaring off against Oakland’s depth.  The natural use case for Normalized teams is exactly this type of matchup, a series across leagues or eras.

Even within a season, the new model teams should play each other well.  While it’s true 1968 hitters will be stronger within their season, so are the pitchers they face.  The model introduces an interesting type of pitcher to the usual mix, the brilliant 2-6; hurlers like Mickey Lolich who have good enough stuff to prevent batters from getting on base better than most 2-7 pitchers, but have trouble on occasion handling extra base hits.  Lolich allowed 23 Homeruns in 230 IP.  A similar NL pitcher would be a guy like the Cubs’ Bill Hands.     

One last note – while this normalization approach I think makes Statis-Pro Baseball a better game than it was in forty years ago in 1979, and it’s a good extension of David C. LeSeuer’s model, I’m not going to claim it can match Strat-O-Matic yet.  No way.  For one thing, I still think most people like the game for within league and season replays, and my guess is the extra work needed to make these cards for that type of replay is too much effort for most gamers.  The real value of such a normalization method only becomes evident once you have many seasons created using this method that can be interplayed.  That takes a lot of effort and time to make work. It's either brilliant or it's crap, and I'll let you be the judge.

Secondly, there are some things about Statis-Pro’s pitching feel and ease of play that appeal to me – but Hal, Steve, et.al., research righty/ lefty matchups and ballpark stats, complex fielding, items probably beyond the scope of a simpler game like SPBB.  The fielding model is better in SOMBB.  The guys at Strat-O-Matic can flat out make some fantastic baseball seasons, and that’s a great game. 

PS- 1972 is the next full Statis-Pro Baseball season.

Saturday, January 19, 2019

Strat-O-Matic College Football, Revised Content (pdf)


The old content had word files that may not work in Office 365.  I've put these files in .pdf formats.
Here are some new links.  Special thanks to Teddy Whitaker for pointing this out.
I’ve also updated the content for the 1953 Lions, 1974 WFL, and 2007 New England.

Link to Other SOM CFB Content on this Blog

2003 BCS.         03 BCS Team Penalties and Notes (pdf)

The Orange Bowl
03 Miami 1              03 Miami 2               03 Miami 3
03 Florida State 1    03 Florida State 2    03 Florida State 3

The Rose Bowl
03 USC 1                 03 USC 2                 03 USC 3
03 Michigan 1          03 Michigan 2         03 Michigan 3

The Fiesta Bowl
03 Kansas St 1        03 Kansas St 2           03 Kansas St 3
03 Ohio St 1           03 Ohio St 2                03 Ohio St 3

The Sugar Bowl BCS National Championship
03 LSU 1                 03 LSU 2                   03 LSU 3
03 Oklahoma 1       03 Oklahoma 2          03 Oklahoma 3

Team Set One
68 OSU 1               68 OSU 2                  68 OSU 3
67 USC 1               67 USC 1                  67 USC 3
66 Alabama 1        66 Alabama 2            66 Alabama 3
65 UCLA 1            65 UCLA 2                65 UCLA 3
62 Wisconsin 1      62 Wisconsin 2       62 Wisconsin 3
47 Michigan 1      47 Michigan 2          47 Michigan 3

Team Set Two
70 Stanford 1         70 Stanford 2            70 Stanford 3
85 Michigan 1        85 Michigan 2          85 Michigan 3
78 Michigan 1        78 Michigan 2          78 Michigan 3

The Game of the Century (Writeup)
CFB All Time Teams Set Penalties   CFB Charts

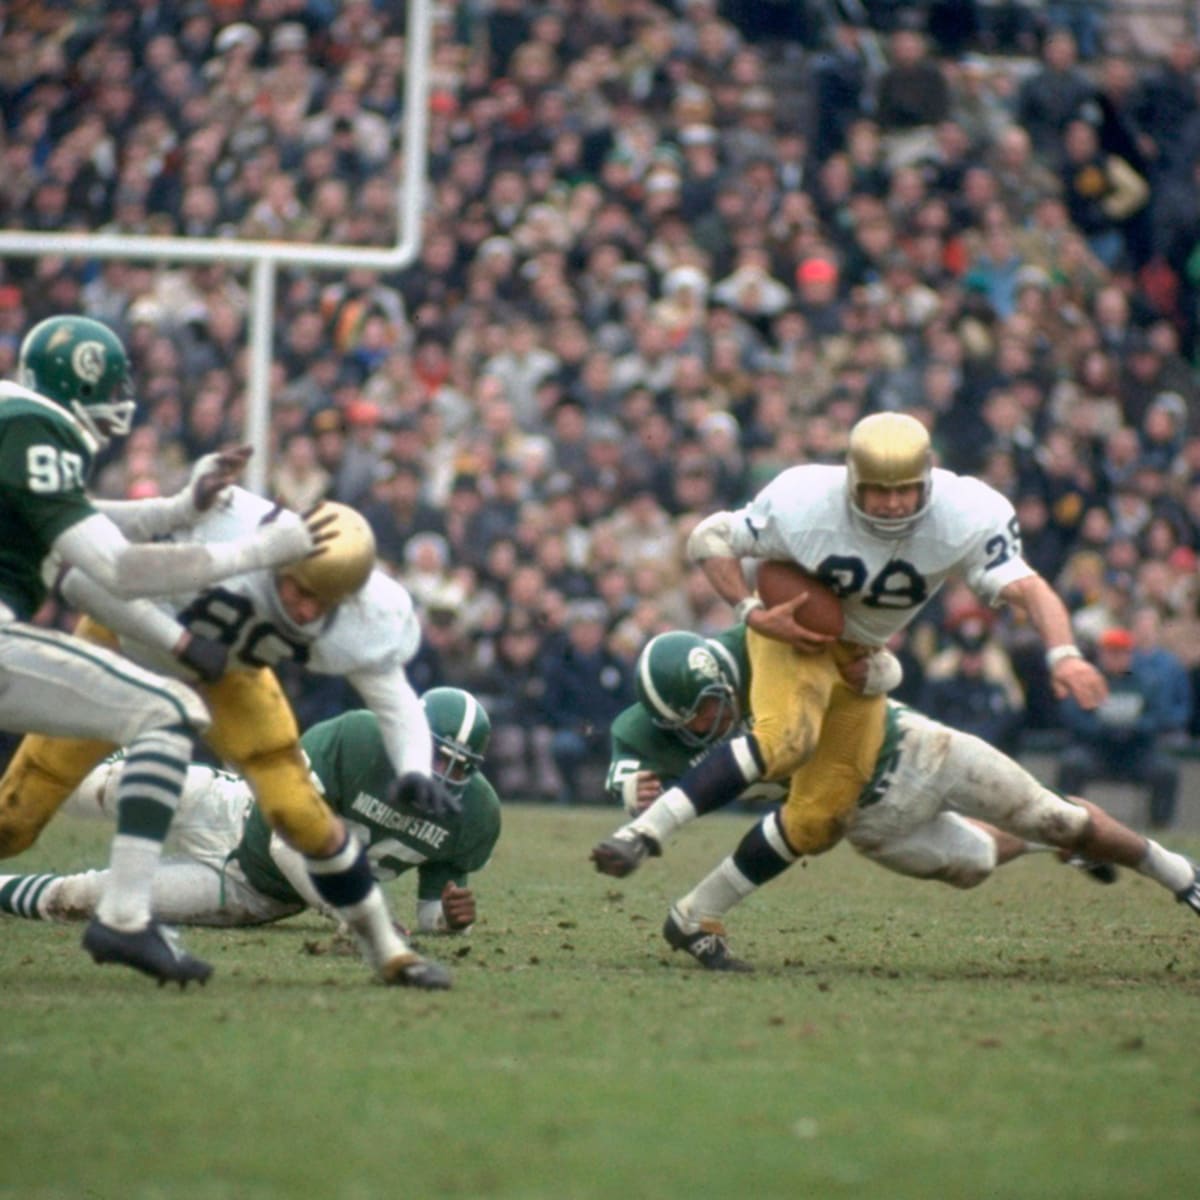
66 Notre Dame 1     66 Notre Dame 2     66 Notre Dame 3
66 Michigan St 1     66 Michigan St 2     66 Michigan St 3


Sunday, December 9, 2018

“Eight Men Out” 1919 World Series for Statis-Pro Baseball


The 1919 World Series for Statis-Pro Baseball


Overview:
I’m not going to go into the general details of the 1919 World Series gambling scandal.  That story has been handled well by numerous other sources already.  I will say I believe they took the money and they threw the Series, in particular Gandil, Cicotte, Williams, and Risberg, who played terribly on the whole, and Shoeless Joe, who flat out admitted it.  They may have gone back and recanted in later interviews and stated they still played hard, particularly after they thought their original testimonies were lost.  But I have a tendency to believe what is stated in front of Grand Juries, where perjury will cost witnesses their freedom.  Throwing baseball games was not technically illegal in 1919, but perjury then as now was a crime, so I encourage anyone who wants a clear picture to find and download these testimonies, and to draw their own conclusions about Eddie Cicotte, Shoeless Joe Jackson or Buck Weaver. I have other reasons to believe they were probably knee deep in these schemes.  There’s plenty of evidence to support that the Sox were throwing games in 1920, as well; I encourage people to Google this often-overlooked fact of the times.  

Only recently have I suddenly taken an interest in this Series, and as I’ve done more reading I realized that with a little work on the rule set these 1919 teams would be just perfect for the Statis-Pro baseball simulation.  Simulation of this Series is one of the ultimate “What Ifs?”  To make teams in this simulation you must make some mathematical assumptions about the relative strengths of the teams.  There are also some other items I wanted to explore beyond the “Who did What, When?’ questions that still persist even now, almost a hundred years later.  These are:

1) The White Sox were favored, by some modern accounts by as much as 5-1, although I will clarify this position.  It was their poor showing versus these expectations that stimulated contemporary investigations into the gambler’s influence on the Series.  What really were the odds?

2) What was the contemporary view of these teams in their time?  Can we learn from the strengths or biases of these views?  

3) Should Chicago have been favored at all?  Would Cincinnati have won the Series outright even if the White Sox had played clean?

4) What can we learn about these teams from the simulation?  How do you play them, and how do they differ from modern teams?

What were the Odds?

Contrary to popular current belief, and the opinions stated in the movie Eight Men Out, the White Sox were not 5:1 favorites, at least not by anyone who didn’t have a partisan interest.  Actually, a review of contemporary newspaper articles thought the clubs evenly matched.  The Sporting News asked leading members of the press to pick the winner and they were split seven to seven on the outcome. James Gould of the St. Louis Star wrote, “Perhaps there has never been a World Series the winner of which is harder to pick in advance.” 

Even partisan observers had the Sox favored by only 2:1 or 3:1 and picked them to win in seven or eight games of the nine games scheduled.  These observations are in agreement with each other as noted in the tables below:


A quirk in the probability of any multi- game series means that a 2:1 favorite does not mean that a team should win two-thirds of its games under normal circumstances against the inferior opponent.  If you model a nine game series, and if the Sox were a legitimate 2:1 favorite this means contemporary observers thought they would win 57 /100 games against the Reds, and would win a nine game series by the game count of either 5-2 or 5-3 (each is about a 1 in 6 chance).  If the Sox were a 3:1 favorite they should win roughly 61 / 100 games against the Reds, and the highest probability ‘mode’ (most likely outcome) in nine games would now be five Chicago wins to two wins for the Reds (19%).  (Interestingly enough, if the teams are truly 50-50, an eight game or nine game win for either team are all equally likely, at 13.7% for each mode.)

The question thus becomes- how reasonable was it to surmise, based on the data at hand at the time, that the White Sox were capable of winning 55-60% of their games against a team that had the highest winning percentage in the National League of the decade? 

The Contemporary View of the Teams

There were reasons why the Reds were not considered a 50-50 team with the White Sox prior to the Series.  I’ll explore them one by one:

1) Reds History:  The Reds had won 92 games in 1898 but in 29 NL previous seasons they could do no better than third place, which is where they ended up at the end of the 1918 season.  They’d finished last as recently as 1916.  Chicago had won a World Series in 1917.  They’d finished poorly in 1918 only because many key members of the team had to leave baseball to support the war effort.

2) NL World Series History: The National League had only won one World Series in the last nine dating back to 1910; that being the Miracle Braves sweep in 1914.  The AL had a 32-17 (65%) record in World Series games during that timeframe, and a 179 to 140 difference in runs scored (62% record predicted by the Pythagorean Model). That 65% record is telling; a team that can win 65% of its games would be almost a 5-1 favorite in a nine-game series.
3) Lineup Balance:  The Sox had three Hall of Famers, C Ray Schalk, 2B Eddie 
Collins, and P Red Faber on their roster at points in 1919, but Faber was not available for the World Series.  The Reds had one, Edd Roush, legitimately one of the best players in baseball at his position in centerfield.  But of course the best Sox players are ineligible for the Hall, so that comparison is not entirely valid.  If you go around the horn, the Sox win outright at C, 2B, and two outfield slots, Cincinnati would win at 3B and maybe shortstop, and the two teams would be more or less tied at one OF position, and at 1B.

C:  Chicago’s Ray Schalk would be considered a better defender than Ivey Wingo and a better hitter than Bill Rariden;

1B:  Chicago’s Chick Gandil, playing on the square, would be a slightly better defender than Jake Daubert at 35 years old.  At the plate they are probably even in their offensive contexts;

2B:  Chicago’s Eddie Collins, at 2B was considered one of the best players of his generation, while the Reds’ Morrie Rath had a great year but was not considered in Collins’ class.  Rath actually outplayed Collins in the series;

3B:  Cincinnati’s Heinie Groh was one of the best 3B in the National League, while Sox 3B Buck Weaver was more of a defense-first type of player who had a good offensive year in 1919;  

SS: Both Chicago’s Swede Risberg and the Reds’ Larry Kopf were considered scrappers who were the weak links in their lineups.  Risberg had some sock for a seventh hitter with 27 extra base-hits, while Kopf sometimes batted fifth for the Reds and totaled 58 RBI. Slight edge to the Reds, even if the Swede was playing on the level;

OF:  Matching up by talent level, Sox LF Shoeless Joe Jackson was probably the equal of the Reds’ Edd Roush, both superb all around players.  But Sox CF Happy Felsch would far outdistance Cincinnati RF Greasy Neale, and Sox RFs Nemo Leibold and Shano Collins would look better on paper than the Reds’ LFs Pat Duncan and Sherry Mcgee.  

(During the Series probably the biggest surprise was the failure of the Chicago leadoff tandem of Shano Collins and Nemo Leibold.  Members of the Clean Sox, nonetheless together they were 5 for 34 with two walks. Leibold alone hit .300 and drew 72 walks in the 1919 regular season. He was on base over 40 percent of the time, but he failed completely against Reds pitching.  He was 1 for 18.)
     
It’s not just this overall balance that favored the White Sox; it was also the impression that they were money players.  Of course they were, but not on the side their fans were hoping for.  Some of the Reds real skills in comparison were lost in the low run context of the National League.  They were very good at manufacturing runs in ways that may not have been obvious to those reading just the box scores. They led their league in walks and triples while finishing second in runs per game, and some of their pitchers were excellent hitters, something the Sox would learn to their everlasting regret once the Series began.

But Chicago countered with a legitimate, historic, run scoring powerhouse.  They possessed five of the top fifteen players in the AL at the dish in 1919, and they averaged 4.77 runs per game while scoring 668 runs in 140 games, numbers that had not been seen since Connie Mack’s Philadelphia Athletics lineups in the earlier part of the decade.  Their .287 batting average was the highest in the A.L. since 1911.
4) Pitching:  You are thinking, how could the Sox have a perceived pitching edge? The Reds clearly had a deep and balanced staff, and they won 96 games by slamming the door on their NL opposition.  If you look at the Series starting pitching situation White Sox manager Kid Gleason faced through a modern lens, you might think without a healthy Faber, and forced to start his aces three times in nine games Gleason was at a distinct disadvantage.  Some contemporary analysts actually saw it that way, which is why they warned Cincinnati might prove more dangerous than most people thought, especially as the Series wore on.  
Modern analysts have the advantage of hindsight, to them, the sabermetrics are clear, the records are in black and white, and any context that might surround the careers of the men in question or the strengths of the relative leagues is now just noise.  But if you look at Sox pitching, alongside Faber’s 20 sub-par 1919 starts there are another 10 starts made by lousy pitchers like Dave Danforth and Frank Schellenback that are not going to be included on any post season roster.  They will have zero effect on the World Series.  
But starters Cicotte, Williams, and Kerr are second, sixth and fourteenth in the American League in pitching WAR.  Cicotte was 44 games over .500 in his seasons with the White Sox from 1912 to 1919 and he completed 30 games in 1919 while winning 29 contests. Williams was 59-30 from 1916 on and completed 27 while winning 23; and Dickey Kerr was a rookie swingman with 13 wins.  Their combined success was no fluke.  All three Sox hurlers who started games in the 1919 World Series would follow with 20 win seasons in 1920.  Cicotte and Williams were considered top-tier pitchers in the AL and Kerr was considered a very solid second line pitcher. 
Meanwhile, on the Reds side;
At the beginning of the Series, Slim Sallee was probably the ace of the staff in terms of his overall career.  He averaged 16 wins a year from 1913 to 1919 and was the Reds only 20 game winner in 1919. In his personal-best season, he was 11th in the National League in pitching WAR.  Sallee was a bright star about to flame out, as he would only win another 12 games in the Majors after 1919.
Hod Eller was the one pitcher that threw hard enough and well enough to cause concern from the Chicago camp. They were well aware that when he was on his game he could dominate. His career ended suddenly in 1921 with the outlawing of the shine ball.  
Dutch Reuther is instructive as a comparison because he played in both leagues.  This was his first full year and it was a breakout year at age 25, his last season would come as a third tier starter on the 1927 Yankees. In between he was an average pitcher with a 3.79 ERA, winning 21 for Brooklyn in the NL in 1921 and 18 for the Senators in the AL in 1925.  He was the kind of pitcher who could do well on a great team with decent run support.  On paper in 1919 he’s excellent, 10th in the NL in WAR, with a 1.82 ERA and 20 CG in 29 starts, but back then nobody thought of him as the equal to Eddie Cicotte. Even Pat Moran, his manager, thought that if he could get just one win out of Reuther in the Series it would be a huge plus.
Ray Fisher is another pitcher who can be used as a comparison.  He was a decent pitcher for the Yankees in the AL for 8 years before he came to the National League, with a record of 76-78 while averaging a 2.91 ERA and a 103 ERA plus.  In Cincinnati, finished 24-16 and he posted a 2.47 ERA and a 119 ERA plus.  Some of that improvement might be the team he was on or the role that he played, but he would not have been considered a top of the roster front line AL pitcher. 
As for the rest – Jimmy Ring had his best year in 1919, but he was wild before that year and really wild after it, walking nearly four men per inning.  Reds bullpen men Dolf Luque and Rube Bressler were probably better than the Sox team of Grover Lowdermilk and the untested Roy Wilkinson, but nobody really thought the bullpens would swing the Series
           
Should Chicago Have Been Favored?  
What Can We Learn From the Statis-Pro Simulation?
I think Chicago should have been favored, but not by a lot.  That’s pretty much my take from this carding, as well.  The pitching analysis comes down to whether or not you believe statistics alone can pitch or whether you look at a hurler through the actual lens of what he is capable of accomplishing.  There were some seasons (1995) where Tim Wakefield had better stats than Roger Clemens, this was during Clemens’ Blue Period in Boston.  In a simulation, a game such as Statis-Pro Baseball, he would have the better card, but if you had to play a real Seventh Game who would you hand the ball to?  It may be unfair to think of the 1919 Cincinnati staff this way, but their contemporaries did. I’ve carded them to the NL distribution, where you need a lower ERA to get a better PB.  This seems to card their depth and quality level well in equal measure.  
Likewise the Cincinnati lineup, while pesky, has some obvious holes, while Chicago only has the Swede as a weakness.  It seems reasonable to me that people would consider Chicago to be the likely winner.  But Cincinnati’s overall pitching depth- as carded- will not make this easy on the Chicago lineup.  If the games go to extra innings and the Chicago starters have to exit the Red’s bullpen strength will likely win out.   The way I’ve carded it the matches are close to a toss-up; if Cicotte and Williams are on their games they can win four games between them, and that means you only need one from Dickie Kerr.  If Cincy can extend the Chicago aces they can win the close ones.
One change I’ve made to my rules is to add the possibility of errors to the hit and run chart.  For example, if you fly out to LF on the Hit and Run chart, now you still check for errors by flipping the next card and checking the error number, rating and type. You do the same with the groundouts.  On the hit and run singles, you first check if the PB result would have placed the result on the pitcher’s card, and if not, then you check for centerfield errors (just like any base hit). You can have ten or twelve Hit and Run chart plays per game with these teams and you will see too few errors without this rule.  Cincinnati makes slightly fewer errors at key positions, so this rule will slightly favor them if they can get men on base.
Both lineups become much more threatening with men on, their speed putting additional pressure on pitchers and defenses.  I think Statis-Pro Baseball really captures the spirit of dead ball baseball. This is a much more entertaining Series to replay, in my opinion, than it was in real life.  You want to hit and run a lot, steal a lot, and bunt guys over a lot.  Because of the arms in the outfield expect a lot of guys thrown out at the plate. Expect a lot of one run games settled by odd plays – bloop doubles off the Z charts, runs scoring on doubles and errors in the outfield, etc.  The teams will make about two errors a game, and they can be costly, especially in the outfield.  For Chicago to win you probably need four wins from Cicotte and Willams, if Cincinnati can run them both at one point early, as they did in real life, the odds start to look bad for the White Sox.

Enjoy the teams!
         
Fred J. Bobberts
February 14, 2018
Chandler, Arizona