
The Second of Three parts on the Team Interception Feature in Strat-O-Matic Pro Football

Emlen Tunnell
OTHER SOM PRO FOOTBALL POSTS:
Okay, so I presented the Design Overview earlier. A lot of the churn about this feature is based on the view that it provides “unrealistic” or “incorrect” results. But I think before anyone can post such a conclusion, they need to understand how to test a season accurately. For the purposes of this discussion I am going to use the 1975 NFL Season’s team interception results. 1975 was a very challenging season to model, and since I have the original charts still on my PC can be sure this set of charts is mine. (If Mike Kane had done 1975, they might be even a better match. But that’s neither here nor there at this point.)
To show you how I test, I will give three variants of 1975 Interception data, for two teams:

Figure 1: Three mock tests of 1975 data
At first blush Variant 1 is way high, averaging half a yard more per interception and an extra TD. Variant 2 is way low, with 60 less yards and one less TD. But I’m going to argue from the perspective of this feature all three Variants are exactly the same. The interception return feature has no control over the number of interceptions it receives, team by team. To control the number of interceptions coming into the model in a season requires many, many replays, at least sixteen and possibly thirty. In the cases above the individual distributions of each team’s interceptions are changing the results in a way that confounds the overall result. If in Variant 1 we adjust Baltimore’s results (i.e. 612 yards * 29/36) and TDs by the interceptions Baltimore should have had, then the results are exactly the same as real life. The same is true for Variant 2, and for Cleveland, as we see below:

Figure 2: Normalized mock tests of 1975 data
There is a strong chance that the overall numbers for any given replayed season may lie to gamers, in part, if in testing you don’t control for the interceptions observed versus the actual interceptions by team. I know this can be troublesome for gamers to digest, but the purpose of this feature is to work with the interceptions it is given, and any testing approach, at least to me, needs to remove interception variance by team as a confounding effect.
(One of the most profound real-life examples of this effect is the 1961 San Diego Chargers, who picked off 49 of the AFL’s 233 interceptions and returned them for 929 Yards and 9 TDs. Those are both the NFL records, and they represent a quarter of the AFL season’s interception return yardage and half the touchdowns. Any change in the simulated Charger interception numbers will also change the results for the AFL. 1960 Cleveland is somewhat similar in this regard, with 6 return TDs and a 20.1 yard return average. Still think this feature isn’t important to team success?)
A look at 1975
Here’s the Real Life Numbers for 1975. Note the “House PCT” is 25/533 or 4.7 pct:
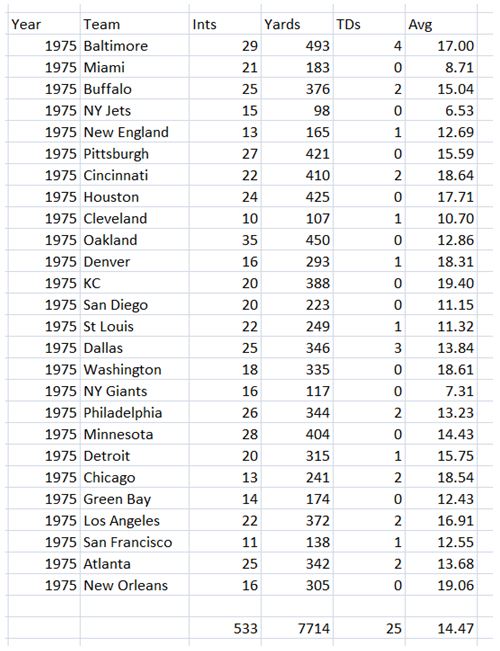
Figure 3: Real Life Data, by
Team for 1975 Interception Returns
Here’s what IRL 1975 looks like graphed. Note the size of the balloon is the TD pct:
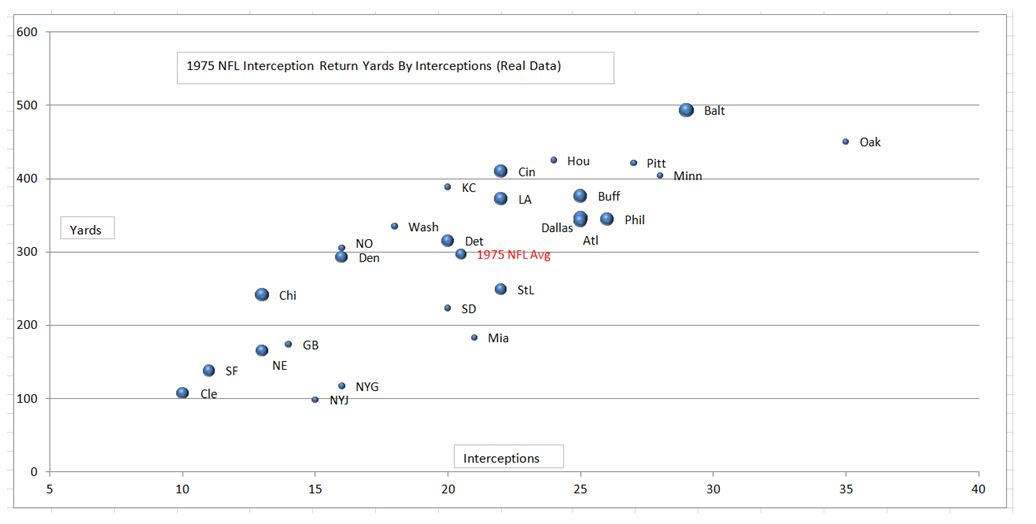
Figure 4: Real Life 1975 Data in Graphical Form
The two most threatening teams were Baltimore, based on their number of interceptions, yards per return, and TDs, and Oakland, based purely on the number of interceptions. Comparatively speaking teams like Cincinnati and Los Angeles were very threatening in spite of middling interception counts, while Miami had close to median hands but feet of lead, and Cleveland could neither intercept well nor return well. There’s some other interesting numbers in here, though – Houston, Pittsburgh, Minnesota and Oakland all failed to score a TD at all IRL in spite of high interceptions counts, yardage per return, or both- all three had over 400 yards in returns but failed to score a TD. Kansas City had 20 returns and 388 yards and also failed to score. This is highly unusual, and I will explore that more in depth later.
I ran six replays (my SOM PC is old and the memory small, so I am limited on what this thing can do) and here is what the results look like in raw form:

Figure 5: Raw Interceptions and
Return Data for 1975 (Six Replays)
The results are all over the board, because in this case Baltimore and Oakland underachieved with respect to interception totals, and Minnesota over achieved. I believe this illustrates my point that you need to normalize the data to the team’s real interception total in order to draw any conclusions. So let’s do so:

Figure
6: Normalized Interceptions and Return
Data for 1975 (Six Replays)
Once you normalize the results for the number of interceptions the teams should have had, a familiar pattern emerges. Sure, Cincinnati is a bit high, and maybe Dallas is a bit low, but it’s only six replays – 12 would be better, and 16 would be ideal. The point is this graph bears a lot of resemblance to the Real Life graph of team Interceptions and Yards. Here’s the chart:

Figure 7: Normalized Interceptions
and Return Data for 1975 (Six Replays) vs. Real
There’s two elephants in the room – one, the yards are lower than expected. And the TDs are higher. Both are actually expected results, and I will explain this in painful detail in another post. There is a reason, and I will cover it.
For my last chart, I want to present six replays of the Stock Rule. For this rule, all teams would have the same theoretical average and same theoretical TD percentages as they use the same chart. One would expect a straight line sloping up as interceptions increase.

Figure 8: Normalized Interceptions
and Return Data for 1975 (Six Replays) using The Old School Chart
And that’s exactly what we do see, to the limits of the fit on only six replays. Teams like the Giants, Jets and Miami are better than real life with this method. Personally, I think the Team Chart is better at describing team relative strengths. This Stock method also provides 42 interception TDs (normalized) versus just below 38 interception TDs by the team method, and only 25 in real life.
I’ve been – well accused might be a bit strong – but certainly charged with –ignoring interception return TDs as an overall desired outcome. Nothing could be farther from the truth. I just understand them differently than most people. I will cover that perspective in detail in Part 3.
No comments:
Post a Comment