Saturday, January 21, 2023

Testing the Team Interception Feature in Strat-O-Matic Pro Football -Pt.2


The Second of Three parts on the Team Interception Feature in Strat-O-Matic Pro Football


Emlen Tunnell

OTHER SOM PRO FOOTBALL POSTS:

SOM PRO FOOTBALL LINKS

Okay, so I presented the Design Overview earlier. A lot of the churn about this feature is based on the view that it provides “unrealistic” or “incorrect” results.  But I think before anyone can post such a conclusion, they need to understand how to test a season accurately.  For the purposes of this discussion I am going to use the 1975 NFL Season’s team interception results.  1975 was a very challenging season to model, and since I have the original charts still on my PC can be sure this set of charts is mine. (If Mike Kane had done 1975, they might be even a better match.  But that’s neither here nor there at this point.) 

To show you how I test, I will give three variants of 1975 Interception data, for two teams:


Figure 1: Three mock tests of 1975 data

At first blush Variant 1 is way high, averaging half a yard more per interception and an extra TD.  Variant 2 is way low, with 60 less yards and one less TD.  But I’m going to argue from the perspective of this feature all three Variants are exactly the same. The interception return feature has no control over the number of interceptions it receives, team by team.  To control the number of interceptions coming into the model in a season requires many, many replays, at least sixteen and possibly thirty. In the cases above the individual distributions of each team’s interceptions are changing the results in a way that confounds the overall result. If in Variant 1 we adjust Baltimore’s results (i.e. 612 yards * 29/36) and TDs by the interceptions Baltimore should have had, then the results are exactly the same as real life.  The same is true for Variant 2, and for Cleveland, as we see below:


Figure 2: Normalized mock tests of 1975 data


There is a strong chance that the overall numbers for any given replayed season may lie to gamers, in part, if in testing you don’t control for the interceptions observed versus the actual interceptions by team. I know this can be troublesome for gamers to digest, but the purpose of this feature is to work with the interceptions it is given, and any testing approach, at least to me, needs to remove interception variance by team as a confounding effect.

(One of the most profound real-life examples of this effect is the 1961 San Diego Chargers, who picked off 49 of the AFL’s 233 interceptions and returned them for 929 Yards and 9 TDs. Those are both the NFL records, and they represent a quarter of the AFL season’s interception return yardage and half the touchdowns.  Any change in the simulated Charger interception numbers will also change the results for the AFL.  1960 Cleveland is somewhat similar in this regard, with 6 return TDs and a 20.1 yard return average. Still think this feature isn’t important to team success?)


A look at 1975

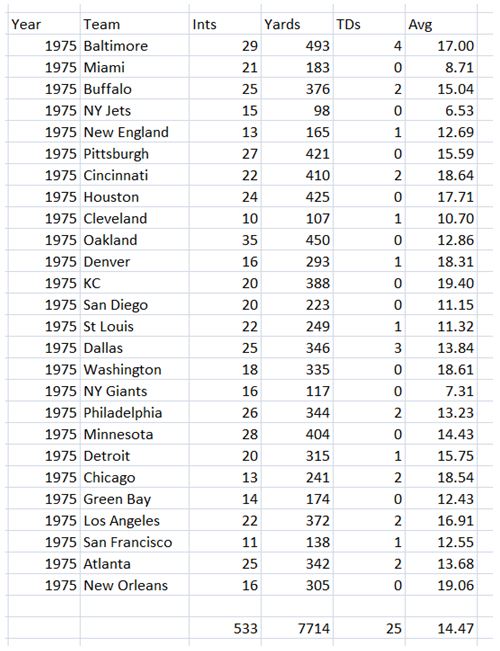
Here’s the Real Life Numbers for 1975.  Note the “House PCT” is 25/533 or 4.7 pct:


Figure 3:  Real Life Data, by Team for 1975 Interception Returns

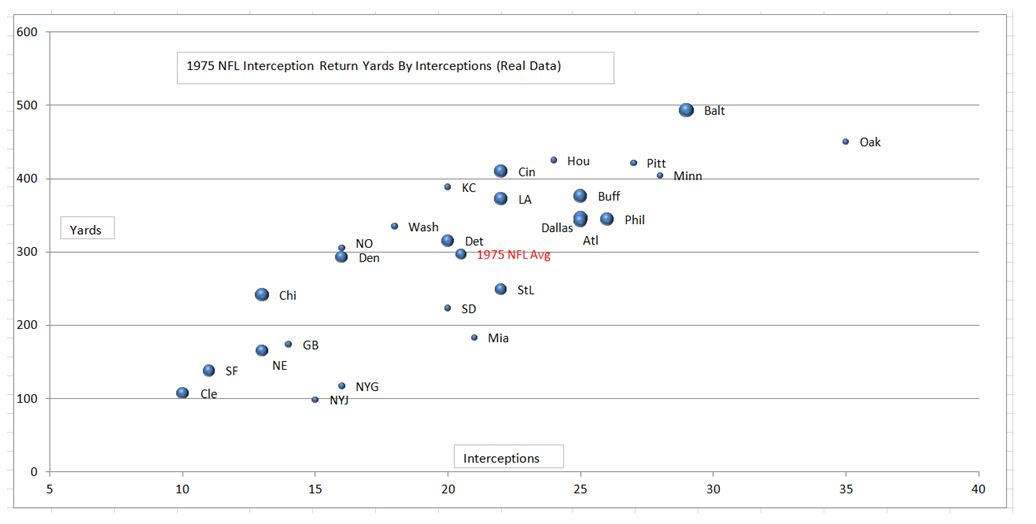
Here’s what IRL 1975 looks like graphed. Note the size of the balloon is the TD pct:


Figure 4: Real Life 1975 Data in Graphical Form

The two most threatening teams were Baltimore, based on their number of interceptions, yards per return, and TDs, and Oakland, based purely on the number of interceptions. Comparatively speaking teams like Cincinnati and Los Angeles were very threatening in spite of middling interception counts, while Miami had close to median hands but feet of lead, and Cleveland could neither intercept well nor return well.  There’s some other interesting numbers in here, though – Houston, Pittsburgh, Minnesota and Oakland all failed to score a TD at all IRL in spite of high interceptions counts, yardage per return, or  both- all three had over 400 yards in returns but failed to score a TD.  Kansas City had 20 returns and 388 yards and also failed to score.  This is highly unusual, and I will explore that more in depth later.   

I ran six replays (my SOM PC is old and the memory small, so I am limited on what this thing can do) and here is what the results look like in raw form:


Figure 5:  Raw Interceptions and Return Data for 1975 (Six Replays)

The results are all over the board, because in this case Baltimore and Oakland underachieved with respect to interception totals, and Minnesota over achieved.  I believe this illustrates my point that you need to normalize the data to the team’s real interception total in order to draw any conclusions. So let’s do so:


 Figure 6:  Normalized Interceptions and Return Data for 1975 (Six Replays)

Once you normalize the results for the number of interceptions the teams should have had, a familiar pattern emerges. Sure, Cincinnati is a bit high, and maybe Dallas is a bit low, but it’s only six replays – 12 would be better, and 16 would be ideal.  The point is this graph bears a lot of resemblance to the Real Life graph of team Interceptions and Yards.  Here’s the chart:


Figure 7:  Normalized Interceptions and Return Data for 1975 (Six Replays) vs. Real

There’s two elephants in the room – one, the yards are lower than expected. And the TDs are higher.  Both are actually expected results, and I will explain this in painful detail in another post.  There is a reason, and I will cover it.

For my last chart, I want to present six replays of the Stock Rule.  For this rule, all teams would have the same theoretical average and same theoretical TD percentages as they use the same chart.  One would expect a straight line sloping up as interceptions increase.

Figure 8:  Normalized Interceptions and Return Data for 1975 (Six Replays) using The Old School Chart

And that’s exactly what we do see, to the limits of the fit on only six replays. Teams like the Giants, Jets and Miami are better than real life with this method.  Personally, I think the Team Chart is better at describing team relative strengths.  This Stock method also provides 42 interception TDs (normalized) versus just below 38 interception TDs by the team method, and only 25 in real life.

I’ve been – well accused might be a bit strong – but certainly charged with –ignoring interception return TDs as an overall desired outcome. Nothing could be farther from the truth.  I just understand them differently than most people.  I will cover that perspective in detail in Part 3.     

Sunday, September 11, 2022

“Wild, Wild, West” - A Lookback at the 1977 Pac-8 Race (Featuring Cards for the UCLA Bruins for SOM College Football)


 Frank Jordan's 38-yarder ended the 1977 Pac-8 race and UCLA's season, 29-27

Dropbox link for 1977 UCLA Bruins Cards for Strat-O-Matic College Football

Link to Other SOM CFB Content on this Blog

The 1977 Pac-8 wasn’t supposed to be very close. Coach John Robinson’s USC Trojans had finished the previous year at 11-1, had beaten Michigan in the Rose Bowl, and finished ranked #2 in the country behind the undefeated Pitt Panthers.  The 1978 USC Trojans would also finish 11-1, also beat Michigan in the Rose Bowl, and would tie for a split National Championship with the Alabama Crimson Tide.  All three teams from all three seasons were loaded with NFL level talent, and yet this year, 1977, USC could only play the role of spoiler in the wacky Pac-8.


A staple play in USC's scheme, Student Body Right.

USC featured QB Rob Hertel, also the Trojan baseball team’s second baseman, RB Charles White, who carried on the tradition of USC tailbacks, and WR Randy Simrin, who at this stage of his career had already surpassed some of Lynn Swann’s receiving records. But Notre Dame would don Green Jerseys in South Bend facing the #5 Trojans, and more importantly they would expose USC’s special teams by faking a FG attempt for a first down (and one play later a touchdown), blocking a punt, and running a muffed extra point in for two. A terminal malaise set in after that, and USC would drop 2 of their next three in-conference games, opening the door for several newcomers. 


Some losses can be awfully difficult to bounce back from 

Of the rest, UCLA had shared the conference in 1975 with Cal, and had finished 9-2-1 in 1976 under first year coach Terry Donahue, but they were seen as at least a year away in 1977.  UCLA did have a lot of talent, with RBs Theotis Brown and James Owens, OL Bruce Davis and Max Montoya, LBs Jerry Robinson and Manu Tuiasosopo, and Kenny Easley in the secondary.  Mike White’s Cal team seemed to be next best bet. Cal had only finished 5-6 the previous year in an injury-marred effort, but had finished 8-3 in 1975 and seemed poised to regain a Bowl bid. Cal featured QB Charlie Young, RB Paul Jones, and WRs Jesse Freitas and Jesse Thompson, along with Kicker Jim Breech. Even back then, before ’81 and The Catch and the wins in Super Bowls in 1981, 1984 and 1988 in the NFL, everyone seemed to know what Bill Walsh would be capable of at Stanford.  He had come to college football to coach after having been a very successful passing game assistant with the Cincinnati Bengals, and he had top-tier talent available to him in passer Guy Benjamin, WR James Lofton, and HB Darrin Nelson.  They did not have a lot of depth nor did they play a lot of defense, But Walsh promised to make Stanford games interesting by filling the sky with footballs.       


The last team on the list was the Washington Huskies.  The Huskies had finished 6-5 in 1975 and 5-6 in 1976, and they hadn’t won a Rose Bowl since 1960, but opposing coaches knew they could move the ball with the best teams in the conference. Not much was expected of them, and a 1-3 start in non-conference games did not inspire confidence in Seattle.  Meanwhile USC and Stanford were undefeated at the top of the conference at 2-0 and 1-0 respectively. 


Pac-8 Conference Records, by Week

On October 8, Washington won their conference opener while Stanford topped UCLA in a 32-29 barnburner in Stanford Stadium to knock them back to 2-3 overall. Cal had come into the weekend ranked 17th and 4-0, but got upset at Martin Stadium in Pullman by Washington State, 17-14. This left three leaders, Washington, Stanford, and USC, who at this point had only lost one game by one point to Alabama.  A week later, Washington did not play gracious hosts to Stanford, whipping them 45-21 to make it a two-horse race. 

Or so we thought.  

USC suffered their Green Jersey beat down on October 22, the same weekend UCLA beat Cal at the Coliseum 21-19 and effectively ended their conference hopes, even though they were 5-2 overall.  It was a shocking fall for a team that had been ranked 15th in the country.  The next weekend the Golden Bears took out their frustrations on the hapless Trojans up in Berkeley. Still reeling from their caning at the hands of The Jeweled Shillelagh, USC dropped a close one 17-14 to the Bears and when UCLA beat the Huskies 20-12 at the LA Coliseum four teams could look at the Sunday papers on October 30th tied for the lead with only one loss in the Pac-8.  

A week later, on November 5th, Washington definitively ended Cal’s glimmering hopes 50-31 up in Berkeley, and by now the rest of the conference knew they were in trouble.  Still, USC regrouped and beat Stanford 49-0 to make it a three-horse race, USC, UCLA, and Washington. This set up the big showdown up in Husky Stadium between the Trojans and the Huskies, which the Huskies dominated 28-10.  The Huskies had now won five of six to tie them with their co-leader UCLA, but their problem was their lone Pac-8 loss was to the Bruins.  They needed help to stop UCLA. 

Terry Donnelly was poised to do something special at UCLA.  But rivalry games are funny, sometimes the lesser team, the team with their backs up against the wall, is like a cockroach- it’s not what they can carry away, it’s what they might fall into, and ruin. 

Stanford won their last conference game over reeling Cal 21-3, and at 8-3 they were poised to claim a Sun Bowl berth. For Washington, a USC win would give the Huskies the sole one loss PAC-8 record and the Rose Bowl, denying the Bruins a Bowl, while the Bruins would go to the Rose Bowl with a win, possibly denying USC a bowl berth altogether. Everything was at stake in that last game. 

And Washington won the 1977 Pac-8 title because USC made sure UCLA didn’t claim it. If the Bruins could have taken down USC, they would have earned a spot in the 1978 Rose Bowl against Michigan. Donahue and UCLA might have gained an even firmer foothold in Los Angeles, changing the trajectory of this series in the late 1970s. But it was not to be.  Even with four losses, USC was able to ruin the Bruins’ season.  (This game is available on YouTube and it is a classic back and forth matchup between these teams.  It looks like UCLA is going to win a heartbreaker but the USC pulls off one last drive.)

USC kicker Frank Jordan made a number of huge kicks in his career at USC. He made a last-second field goal in 1978 to beat Notre Dame and keep the Trojans on course for a national championship.

But on a late November day one year earlier — inside the very same Los Angeles Coliseum — Jordan booted UCLA out of the Granddaddy, and gifted a four-loss Washington team with a ticket to Pasadena. Jordan hit a 38-yard field goal with two seconds left to give the Trojans more than a 29-27 rivalry win over UCLA; it also made sure that USC remained in charge of this rivalry, and that Donahue’s ascendancy would have to wait. The victory also carried USC into its bowl game, a Bluebonnet Bowl blowout of Texas A&M, which reset the Trojans’ outlook for 1978.  UCLA did not make a bowl in 1977, and they would have to wait until the next year, and the Fiesta Bowl.  Washington changed their trajectory, as they made their first of fourteen bowls under coach Don James, culminating eventually in the 1991 National Championship.

UCLA (7-4)

Offense (Split-Back Veer) – The heart of the Bruin offense is their strong running game.  UCLA averages 4.3 yds/carry led primarily by the LHB combination of James Owens and Freeman McNeil.  This duo contributes over 1,300 yards at a 5.2 average per clip, along with 7 TDs.  RHB Theotis Brown and Glen Cannon kick in another 877 yards for a 4.7 average and 6 TDs.  The QBs, Rick Bashore and Steve Bukich, grind it out for a 2.4-yard average (3.9 yds after sack adjustments) and 6 TDs.  The Bruin passing attack is not awe-inspiring, but it is functional with a 51.1% completion percentage and 14 yds/reception. The main deep threat at wide-out is FL Homer Butler who averages 22.8 yds/catch and leads the team with 4 TDs.  

Defense (3-4) – UCLA’s 3-4 defense highlights 3 notable All-Americans—DT Manu Tuiasosopo, FS Kenny Easley and LB Jerry Robinson (consensus All-American).  The Bruins are tough against the run, only allowing 3.2 yds/carry (3.6 after sack adjustments), but they occasionally struggle vs. the pass.  The Bruins allow a 56% completion percentage for opposing QBs and the UCLA front three is sometimes challenged in sustaining a consistent pass rush, resulting in only 23 sacks on the year.  On a positive note, the UCLA defense intercepted 15 passes and averaged over 19 yards per return with 3 “pick sixes.”

Special Teams/Intangibles – PK Frank Corral is a “50-50” kicker who connected on 13 of 27 attempts.  He will drive coaches crazy when the Bruins are in scoring position because he is so erratic.  The Bruin return teams don’t provide a lot of value either as they only average 16.2 on kick returns and 3.8 on punt returns.  On the punt coverage side, UCLA only allows 6.1 yds/return but do give up a “long gain” opportunity. 

Fred Bobberts, Albuquerque, NM, Original Date of Publication 9/11/2022

Cards by Chris Stewart, Republished with Permission

Sunday, September 4, 2022

Team Specific Interceptions for SOM NFL (Design Notes from V10) - Pt.1


(Since this came up again this year, more than a dozen years after the option was introduced, I figure I owe you all at least the original design intent of the feature. I realize this does not make everyone happy but gamers can usually draw their own conclusions based on the reasoning.)


Team Specific Interceptions for SOM NFL (Notes for V10)

(Copyright The Strat-O-Matic Game Co, June 12th, 2010, all rights reserved)


OTHER SOM PRO FOOTBALL POSTS:

SOM PRO FOOTBALL LINKS


This what team interceptions look like, with the size of the bubble indicating the relative number of automatic interceptions a team should get. That SOM bubble is what the stock rule provides.  

Okay, well, the other shoe fell. Now you see why my time was constrained. I had to research and quantify and try to distribute and modify int results for almost a thousand teams, and like every other thing I do, this was done entirely by hand. So it was like another season in terms of time, and yes, it stopped me from attempting something else this year, although there were other factors.  

Well enough of that- how these models work of course is somewhat dependent on what you do as a coach. The model assumes you will not elect to return every int (because all teams still have that fumble on 11). It still depends on the flat pass return ints that the standard chart has. Because older seasons have more flat ints, and these become TDs more readily, there are subtle changes to the model as you go farther back, and ints become more frequent.  

Smokey Joe hit the target right on, a TD is not worth as much as you might think in terms of yardage, that was what he contributed earlier that broke this wide open. A long return on a team's card, while visually appealing, is not as valuable as its nominal total. The reason why is that a longer return number has a better chance of turning into a TD from more places on the field, and of course, that pesky end zone gets in the way and shortens the return when this happens. 

A reasonable but not perfect model is 10*log(yardage)^2.5 which looks like this:

Nominal      Observed (what it’s actually worth in a replay)
5                     4
10                   10
15                   15
20                   19
25                   23
30                   27
40                   32
50                   38
60                   42
75                   48
100.                57

That's base ten log.

The marginal value of another yard on a return will decline as the return gets longer. This model is good to about 3% of observed. The idea that it is log limited makes sense to me, since the boundary condition of of where the int occurs can be modeled on field position after the int, and the impact on length is skewed, and not normally distributed. It is a geometric (hyperbolic) model with powers greater than one in the expression. 

(Think prob*likely return length, the value is initially small, then becomes progressively greater farther down the field, then compresses again at the far end of the field.)  

The goal of each team's distribution was to model as best I could:

1)The team's yardage per return;
2)The team's chance to "house" a return, based partly on the predicted or expected results from its yardages, and based on real life. 
3)The actual yards found in a team's record, and the “chunkiness” or distribution of a type of returns, that is if roughly a quarter of returns were 28 yards
there is likely to be 7 or 8 chances for that length of return;
4) The CMs can and do kneel on returns; this will add arbitrary “0 yard” returns to the simulated effort;
5) Where I can, the teams longest return is on the chart.  99 yards is the max in this framework. 

What this means is if a team had a high average and few TDs, you can expect that the TDs it would get would come from its yardages. But if a team had a higher TD percentage than its yards per return or distribution would normally account for, I might use the power of the automatic TD to get this team closer to its goal, and the league closer to its goal.

Based on the team's distribution of gains, if it looked like they returned nearly every return, they were going to get that type of chart, chunky returns get chunky charts.

These are the primary constraints. I could not balance all of them perfectly for all teams. But I did get them to work well, especially at the league level, where you can see the results develop in as few as four replays. Individual teams, of course, take longer to test.  

There are a few assumptions and limitations- 

1) I mentioned the fact not all returns are considered to actually be returned- there is some flex in the model for this, but in general I used the CM's logic. Remember- kneed returns usually count for a big zero for their teams, so if the charts look a tad high, they are, because they account for this. 

Of course, now that coaches can see returning ints if you are in charge of '04 Baltimore is like having Rick Upchurch get TWO trys sequentially to roll a 1982 punt return on his card, this decision-making ruleset may not always be realistic. Teams may try more returns in human managed games.

2) The game is limited to 99 yards for the chart, so about a dozen or so teams with 100+ yard returns have 99s instead and this has been incorporated into their model. This is a PC constraint we have to live with. Cards - n -dice guys, though, could sub that yardage back for feel (Ed Reed will be happy.)  

3) Obviously throw more or less flat and you can change your opponent's results. One thing this might do is make coaches more circumspect about using flat passes to kill the clock with a lead, which I like. 

The goal of course was to see if we could get teams to exhibit that 600 yard return season if they did so, or be limited to their 100-200 yards if they did not. By and large this system is an improvement by quite a bit over the stock system, and since I argued for years that it would not be useful to even try this, I can only say one thing-

I was wrong.

Fred

“Kicking up a Storm” in The Southwest Conference (Cards for the 1977 Texas Longhorns for Strat-O-Matic College Football)


 Russell Erxleben, 1977

Dropbox link for the 1977 Texas Longhorns for Start-O-Matic College Football

A Lookback at the Time When Kickers Were Legends

(Note that Arkansas (Orange Bowl) and Texas A&M (Bluebonnet Bowl) are already published here)

Link to Other SOM CFB Content on this Blog

Texas had Earl Campbell, but some people believed that the most potent weapon in burnt orange was the tall dude with the three shoes and the Martian surname Erxleben. Actually, the name is German, and Russell Erxleben did not have three feet. On his left foot he wore a regular white football shoe, and on his right, depending on the situation, a regular shoe for punting, or a square-toed one for place-kicking, both of which he did exceedingly well.

On an October Saturday in 1977 in Austin's packed Memorial Stadium, Texas beat 13th-ranked Texas Tech 26-0 and took another giant step toward the Cotton Bowl. Campbell rushed for 116 yards against a defense keyed to stop him; the defense, aided by a holding penalty in the second quarter and the fact that injured Tech Quarterback Rodney Allison was in for only four plays, got itself a shutout. 

And Erxleben, trotting into the game for just 15 plays, was devastating.

He punted five times for a 44-yard average. Two of his six kickoffs landed beyond the end zone. With Texas leading 7-0 near the end of the first half, a Longhorn drive stalled on the Tech 44. Coach Fred Akers sent in Erxleben wearing the placekicking shoe. In the first quarter he had missed a 56-yard field goal into the wind. This time he had the wind with him, and he kicked it through the goalposts from 60 yards away.

It seemed as if a fellow who can kick 60-yard field goals should be allowed to mail in his extra points, but Erxleben blew the try after Texas' second TD. He made up for it with a 35-yard field goal late in the fourth quarter.  "You know what that guy does to you?" asked Oklahoma Assistant Coach Larry Lacewell, whose Sooners lost to Texas 13-6 as Erxleben made good on attempts of 64 and 58 yards. "He puts you in a goal-line defense on the 50-yard line."  


  Tony Franklin, 1977

Meanwhile, over in College Station, Texas A&M's Tony Franklin was helping the Aggies beat SMU 38-21 by kicking a 54-yard field goal and five PATs (he had not missed an extra point this season). Like Erxleben, Franklin was a junior, but he used only one shoe; his kicking foot he kept bare.

And against Rice, Steve Little of Arkansas, a sidewinder, kicked field goals of 52, 44 and 29 yards, punted three times for an average of 52.3 yards, and six of his seven kickoffs could not be returned as the Razorbacks won 30-7. Little was a senior and the three field goals brought his career total to 46, just five makes short of the NCAA record, which he later set with 53.


 Steve Little, 1977

Just another typical Saturday in the Southwest Conference, where between 1976 and 1977 had produced the five longest field goals in modern NCAA history.  This era is enshrined in history, as the tees they kicked off were outlawed in 1989.  But in Texas and Arkansas in 1977 "being in field-goal range" meant a team had stepped off its bus outside the stadium. It was such a competitive league for kickers that Texas Tech's Bill Adams, who made 47-and 52-yard field goals against Rice, and Baylor's Robert Bledsoe, who had a 47-yarder against SMU, were considered mere chip-shot specialists.

It was the barefoot booter, Franklin, who in 1976 boomed the opening shot in the long-range barrage. Against Baylor, on a wet field with about a six-mph wind at his back, the Aggie sophomore followed his usual routine. He stared at the maroon spot painted on his white, hard-rubber tee. The holder placed the ball straight up on the tee with the laces facing the goalposts, and Franklin, approaching from the left side like a soccer sidewinder, kicked it through from 64 yards away, an NCAA record. But not for long. A while later Franklin kicked one from 65 yards out. 

All told, Franklin made 17 of 26 field-goal attempts last year and 30 of 32 extra points to rank second in scoring in the SWC. In 1977 he hit on 16 more three-pointers, including four in the final quarter against Texas Tech to give the Aggies a 33-17 come-from-behind win. He had also kicked a 76-yarder in practice.

In the summer Texas' Erxleben, a good friend of Franklin's, ran three or four miles before work and again after work every day, training to top Franklin's distance record. As he ran, he kept repeating to himself, "I'm going to get Tony this year. I'm going to run and run until it hurts so bad, but I'm going to get him."  Get him he did early in 1977, against Rice. With the score 54-7 in the third period and the ball on Texas' 49, Coach Fred Akers called for the punting team, but Erxleben persuaded him to try a howitzer-range field goal. Erxleben took off his punting shoe and put on his square-toed placekicking shoe (the toe is tied up slightly to give his kicks more loft). He wanted to get a two-yard margin over Franklin, so he moved the tee one yard farther back than usual, to 67 yards. The ball sailed "dead through the middle" with the help of an eight-mph wind.

Two weeks later it was Little's turn. Against Texas, with a 20-mph wind to his back in the second quarter, he put his size-seven shoe and all his body whip and hip rotation into a kick from his 43 and made it, to tie Erxleben's record. That prompted Erxleben to send a note to Franklin: "Don't you think it's your turn to kick a 67-yarder? Remember, no farther!"

For his part when he was a sophomore Tony Franklin kicked a city-record 51-yard field goal. The record was broken two years later with a 52-yarder by the star kicker at rival Eastern Hills High School, a German immigrant named Uwe von Schamann, who now was Oklahoma's field-goal specialist in 1977.  "Von Schamann didn't kick anything farther than that during the year, and I didn't either," says Franklin. "Then in the playoffs our teams met. On the fourth play of the game I twisted my right ankle and kept it in an ice bucket. Right before halftime the coach said, 'Well, it's fourth down and we've got a little wind, you want to try it?'  I said, 'Yes, sir, it's probably the last time I'll have a chance to get my record back.' "

With a sore ankle, Franklin went out and kicked a field goal from 58 yards, not only surpassing von Schamann but setting a state record as well. The Texas high school field-goal record is now 62 yards, held by Russell Wheatley from Odessa. "Tony could have kicked 60-yarders in high school," says one of the coaches at Arlington Heights. "Every Thursday at the end of workouts we'd finish up with field goals, and Tony would kick 50-and 60-yarders. It really gave the team a big lift to see the ball go through."  

All three college kickers needed to make adjustments when they reached the pros. Without the placekicking tee, they lost between 10 and 15 yards on their kicks. "It's just like hitting a golf ball," said Kansas City Chiefs Scout Tommy O'Boyle. "You can hit it a lot farther off a tee than off the ground." They also aimed at a smaller target. College goal-posts are 23'4" wide (they were widened about five feet in 1959), while in the NFL they are only 18'6" apart. Erxleben, along with all the other straight-ahead kickers, was not able to tie up his toe or wear a square-toed shoe; he was successful as a punter but not as a kicker.  Franklin was the only kicker to see extended success in the NFL.

Probably the most important rule difference, however, was that in the NFL in this era, after a failed field-goal attempt, the ball came back to the line of scrimmage, thus discouraging long tries until the final seconds of a game. In college the ball comes out to the 20, and thus missed 60-yarders are the same as long punts—with the exception of coffin corner kicks.


Fred Bobberts, Initial Date of Publication 9/4/2022 (Reprinted with Permission)

Special Thanks to Chris Stewart 

Sunday, August 21, 2022

“Basketball in the Bubble” – the 2019-2020 Season for Statis-Pro NBA Basketball (Featuring New Rules for the Modern "3 & D" Game)


“Basketball in the Bubble” – Cards for the 2019-2020 Season for Statis-Pro NBA Basketball

Link: Statis-Pro Basketball Cards for the 2019-2020 NBA Eastern Conference

Link: Stats-Pro Basketball Cards for the 2019-2020 NBA Western Conference

Other Statis-Pro Basketball Links

I love Statis-Pro Basketball, in part because it successfully modeled an era of late Seventies hoops that I admired; offense in the paint, and the apex of the Big Men.  Growing up in Detroit, the Seventies teams I followed may not have won much, but we had Bob Lanier, and big time assist guys like Kevin Porter.  “Big Bob” could play defense, block shots, rebound and score, and he was fun to watch during the time when centers like Bill Walton, Kareem Abdul-Jabbar, and Robert Parish were rare and desirable players.  You could obtain Greatest Teams for SPBB, including the 1969-1970 playoffs, and great centers like Wilt Chamberlain and Willis Reed would plug right in.

Put simply the game was modeled to reward teams that could pound the ball inside, score off the dribble, steal and rebound.  The ideal team would have a point guard who could play defense and pile up great assist numbers, like Walt Frazier, a Center who could rebound, defend, defend the rim, and score like Kareem or pass, like Walton, and at least one scorer with a lot of stamina and no secondary results, like George Gervin, or Julius Erving.  You could surround such a team with more scorers, a defender who had a high steal rating, and another ball handler, but nothing helped these teams like another rebounder.  Hence a Walton also had a Maurice Lucas, Kareem would have a Kurt Rambis, and Reed had Dave DeBusschere.  In a game where two point Field Goals were the only outcome, high pct FG shooters in the front court were the premiere weapon, and when they failed you wanted to clear the boards.  It’s a simplistic model, but it did generally reward the best teams in the NBA, who followed mostly the same regimen.

This mostly flowed forward to the Eighties, where the Celtics were built around Parish, Bird, and McHale, and the Lakers had Kareem and the great assist man in Magic Johnson.  Teams had three-point shooting but it was more of a secondary option.   Basketball was a war of attrition played in the paint, where rim attackers like Michael Jordan could overcome the increasingly suffocating defenses played by teams like Detroit.   Jordan was a career .510 shooter in the paint, but his 0.327 shooting from beyond the arc meant his career eFG% was only 0.509 – great for then, but far behind Steph Curry now (0.583 eFG%).  Note that Jordan averaged 37ppg in 1986-87 in a league where the teams averaged 109ppg.  He was able to maintain a very high level of productivity in a league where you had to try almost 27 2pt FGs a game to accomplish what he did. 

Because the 3 pointer was almost an afterthought in 1987 (teams hit about 30 pct of about 4.7 tries per game) the SPBB game didn’t need to change much to accommodate shooting beyond the arc.  They tacked on a 3 point range and a rule with a shot limit and for years this was satisfactory.  You could play the 3 pointer as a gadget play and the typical game flow would not be affected.  But at some point after 2000, the 3 pointer doubled in team per game tries, from 14 attempts per game to its current level of 29 attempts per game, and teams featured specialists just for this purpose.  Mid range jumpers that weren’t threes started to disappear from the game, because these averaged less than 50% success, and points per try at this range were well under 0.9ppa, while triples made at better than 33% could create greater than 1.0 points per try.  Teams realized that they could improve their offense by simply changing their shot selection to avoid these longer mid-range two point attempts.  The change was gradual at first, but by the early 2000s, teams were drastically reducing their mid-range attempts in favor of the more efficient 3-pointer. In 2014-15, NBA teams, for the first time, were more likely to shoot a 3 pointer than a mid-range jump shot. Today, 1 in 3 Field goal attempts is a 3 point field goal attempt.   Teams found that they could take more threes and score more points.


Why does this matter?

It matters because the way players were traditionally carded, and the rules were written, the cards for the current best shooting teams would not be the best shooting teams anymore. You traditionally carded a player based on their overall FG percentage and scoring.  For Steph Curry in 2017-2018, he would normally be rated as a primary range 11-48 with no secondary field goal range, and an 11-43 range on threes.  But Steph made almost 60% of his two pointers; on offensive rebounds he would underperform.  In the old model, assists could ‘counter’ the loss of 2pt field goal efficiency because you would never try enough threes for it to really matter.  But in 2017-2018 Steph tried almost ten three pointers a game and had an eFG% of 0.618.  You would never get that eFG% in a simulation that featured that 11-48 primary shooting range with that 11-43 three point range as well.  You would never try many threes at all with his card; instead you would try to use his assist rating to attack the hoop as much as you could with his stamina.  But that’s not Steph – I mean, he can do this, but his game is long range shooting.  The whole NBA now is based on high efficiency long range shooting.

If you look at 2019-2020 Houston as a team, they finished second in the NBA in scoring while shooting only 0.451, ninth from the bottom.  But they shot as many threes as they did two pointers, at 45 per game each, and their 2pt FG% was second only to Milwaukee at 0.557.  2019-2020 Houston shot an eFG% of 0.531, fifth in the NBA, they are tremendous shooting team.  As a small-ball team, if you card them to the old system and play by that rule set their primary FG ranges are low while other teams will have role players who can shoot 11-58 at the rim; these teams will kill them on put backs and they will be lucky to win games, but in reality they won their division.  So that means the cardings and rules have to change to accommodate the current reality – efficient three point shooting and two-way wing talent wins games in the modern NBA, and player versatility matters.  The NBA is a different game than it was on 1978, and Statis-Pro Basketball needs a different way to card and a different set of rules.           


The old carding and rule set no longer works. I’ve tested a new carding and a new rule set, and here is the gist:

Three and D Rule Set

Carding changes:

Players are now carded to position, point guard, shooting guard, small forward, power forward, and center.  No more just guard, forward, center.  No more off guards playing defense on the ball at the point unless they are carded to do this. I’ve checked the depth charts and lineups for these.

Some players have the center position as their last position, and that position is the third position or greater.  An example is 2019-2020 Robert Covington, a PF-SF-C.  They can play center in Small Ball lineups, more on this later. Small Ball can compel an opponent to make changes to counter it.  

The biggest carding change – the Primary is now carded for the player’s 2pt FGA attempt pct.  This would normally create a real problem for some low attempt forward or guard types who normally score off rebounds, have high Primary ranges such as 11-58, and would become deadly on the advance with that second pass.  These guys (thinking Artis Gilmore or Dave Twardzik types, twisting corkscrew layup shooters) would be unsung highly valuable players in the old game, but I have another rule to deal with them, and to place them properly with their real values offensively. Simply put, you won’t always be able to advance the ball in to get that high percentage Primary two point shot.

Timing:  

The pace of the game will be much faster, so in order to stay in line with team’s usage, you remove five cards from the deck, i.e. 40 cards instead of 45.  This means 160 sides per quarter, or 4.5 seconds per card.  The easiest way to accommodate this is to shuffle the 45 cards (normally 180 sides per 12 min quarter) and remove 5 each quarter completely.  The remaining 40 cards are now 160 sides in a quarter.  I tested this somewhat empirically, and I encourage anyone else testing this ruleset to chime in. 

Rules Changes:

On the play coming up the court (Action:) if player is rated for the three, you can either shoot the triple, adjusted by the defender, or shoot a two pointer off the secondary range (if the player has one, usually not a great choice), adjusted by the defender, or the primary range (if the player does not have a secondary range) adjusted by the defender, or pass the ball (advance).  Under these new rules a two point shot from the primary range is no longer guaranteed past this point. On the first pass, you can choose the triple (if target is rated) or the double. 

The one exception is fouled in the act of shooting from Action.  Fouled in the act of shooting here is considered a 2 point FG attempt, resolved from the primary attempt column, and a miss results in two attempts.  A make results in the “and one”.  Three-point attempt fouling will be handled later, below. 

On each Advance, assuming that first player does not shoot the ball, you have several outcomes:

a) Pass To (position)… i.e. Pass To F1, for the player who receives the pass, this attempt cannot be shot as a two point shot.  The player must either pass it again or shoot it as a triple, adjusted by the player’s defender.  This now tremendously diminishes the value of players who cannot shoot threes or pass.  Pass To (Positions) results with their variants (like steal chances) come up more than half the time off the Advance column;


b) Pass To Choice…the player who is chosen to receive this has the choice of either a 2 point attempt off of his primary range, adjusted by his defender, or a 3 point attempt, adjusted by his defender.  Here a “And Fouled in the Act of Shooting” on the Shot Number… will result in a potential two, three, or four point play depending on that prior shot choice.  If this shot result comes from a three point choice, it’s three free throws or a three point made basket and one free throw.  Pass to Choice results come up in the Advance column only about one seventh of the time, so if you get one and the game situation allows for it, this is your chance to pound it inside to someone who otherwise cannot shoot, or find someone with a bad defender on him for a good three point chance.


c) Pass to Choice (Use Passer Assist Rating)… the player who is chosen to receive this has the choice of either a 2 point attempt off of the passer’ assist rating, or a 3 point attempt, NOT adjusted by his defender.  Here an “And Fouled in the Act of Shooting” on the Shot Number… will result in a potential two, three, or four point play depending on that prior shot choice.  If this shot result comes from a three point choice, it is three free throws or a three point made field goal and one free throw.  Pass to Choice (Use Passer Assist Rating) results only come up in the Advance column about one chance in five, so a great passer should try to pass it inside, and a poor passer should aim for the best three point shooting chance.  Too many poor passers, however, and you wind up unable to attack the rim. Having a good passer in the front court becomes very useful in the modern NBA.


d) You may advance the ball twice, just as before, in the original ruleset.  


e) On Offensive Rebounds, the rebounding player may attempt an adjusted 2 point shot attempt using his Primary column.  They may also choose to advance the ball in a normal manner.  


f) If someone shoots and makes a three on an initial pass to the forecourt after a defensive rebound, it counts as an assist for whoever had the ball before the shot. 


g) If on the last allowable Advance passes the ball to a player who cannot shoot threes and the game situation requires a three point attempt, i.e. a Pass To…(position) then that player must shoot using his secondary column, if he has one. If he does have a three point column, no matter how bad it is, he must shoot it; this means you, Russ.  This is the one situation where 2019-2020 Russell Westbrook will kill you if he gets the ball last.  I love Russ, but just like in real life his shot selection can be frustrating!


h) You are allowed the choice to fast break on any steal. This has implications under Small Ball Rules.


“Small Ball” Rules

Some players have the center position as their last position, and that position is the third position or greater.  An example is 2019-2020 Robert Covington, a PF-SF-C.  If you play a player like this in the center position, you can declare a small ball lineup. Small ball lineups pay a price for rebounding but gain an advantage in fast breaking unless they are countered. A player rated as a PF-C alone is not a small ball center (although he is still useful against such a lineup, see below). The player must have three positions and the last position be designated a C.

If a team goes to small ball and their opponent keeps a player in the center position (the 5) who is rated as a Center ONLY (C) or a Center FIRST (C-PF) then that opposing team will pay the small ball penalty.  The penalty is, after all adjustments are made, the small ball team moves up one fast break rating from the normal placement (i.e., from B to A) on offense and the opponent moves down one rating (i.e., from C to D) on offense.  The Small Ball team is thus quicker on both fast break offense and defense.   

The small ball lineup may be successfully countered by placing a player at the Center position (the 5) who is rated at more than one position and the C rating is last, i.e. a PF-C.  If such a player is subbed in no fast break penalties are assigned.  The opposing team might choose also to place small ball pressure by also playing a player where the center position is their last position, and that position is the third position or greater.  This means both teams have true small ball lineups playing and if either should attempt to bring in a true C or C-PF type player they will pay the fast break penalty.  So a team has a choice to either counter a small ball lineup, or to also assume one, and some teams are carded to be better at this than others.

Small Ball Example:  2019-2020 Houston and 2019-2020 Los Angeles

Los Angeles has a nifty front court with dangerous (5) substitute candidates in Dwight Howard (rated as a C-PF) and JaVale McGee (rated as a C only), who are great rebounders, put-back artists off the offensive boards and rim protectors.  In theory the ‘19-‘20 Rockets have Clint Capela carded; but in practice they traded Capela to Atlanta in mid-season and he got hurt.  He’s not really a Rocket; the Rockets at the end of the year don’t have a true (5) on their roster.  LA is rated a “B” on their FB offensively, the Rockets are a “C” defensively, which resolves to a “B” final rating for LA.  Houston is rated an “A” offensively and LA an “A” defensively which resolves to a “C” final rating for Houston. 

It is very much in Houston’s game plan to limit LA’s use of Howard or McGee, and they really don’t have a choice, so they would use one of their five “three position, center last” players at the (5), House, Carroll, Caboclo, Sefolosha, or Covington, who now holds a very key spot in their lineup. They can play a more standard lineup with Jeff Green at the (5) and P.J. Tucker at the (4) but this is an unlikely rotation against LA.  


Placing one of those three position Centers at the (5) – we’ll say Covington now forces the Lakers coach to make a choice- leave Howard or McGee in at the (5) to clear the boards and dominate inside to a point, but now Houston’s Small Ball lineup moves UP to the “B” fast break chart while LA moves DOWN to the “C” fast break chart.  Remember steals can be fast breaks in this new ruleset, so what you gain on the boards you can lose in transition.  The Lakers could move Anthony “Street Clothes” Davis (who is rated at PF-C) to the (5) which is exactly what they did in most cases in these situations.  This move counters the Small Ball lineup and negates the FB penalties, but does not put small ball pressure on Houston.  For that, the Lakers could use Kyle Kuzma, a PF-SF-C at the (5) and now if Houston did move to a standard lineup it would be LA with the “A” fastbreak and Houston with the “D” fastbreak, something Houston would want to avoid at almost any cost.       

An Example of the 3 and D ruleset using the Rockets and Lakers    

 The Rockets have just made a Defensive Rebound against the Lakers.  We’ll give it to Tucker for argument’s sake.  The Pass comes up court to Harden at G2 against LeBron James.   This is an interesting moment because Harden can shoot 11-47 as a 2 pointer or 11-32 as a 3 pointer and he has all the stamina in the world as a shooter.  If he does shoot and makes give the assist to Tucker. But Harden is also an excellent passer at 11-62 so he’ll kick it (advance one).  The result is Pass To: F1 in this case the small forward, we’ll say that’s McLemore.  In the old rules Ben could shoot it at 11-62 on his Primary, but in this ruleset if the result is not an “Assist Rating Pass” or “Pass to Choice” McLemore has to shoot a guarded 3 pointer. Whether it’s Kuzma (a 0 defender) or Green (a minus 3 defender) this is likely as good a chance as any; the first is a 39% chance at three points and the second is still 34%, which is better than a point per attempt. McLemore can shoot up to 12 3 pointers a game and is useless in almost every other way, so you shoot it, but we’ll assume he passes.  A “Pass to…” G1 (Westbrook) would be bad, because Russ has to put up the 11-28 three pointer adjusted by his defender (we’ll say Caldwell-Pope, a minus 1);  in the case of a “Pass to Choice” however the same pass to Westbrook could now use his Primary at 11-48 (minus 1) or 11-47. An “Assist rating” pass allows for an 11-41 two point shot (which is a terrible idea) or an unguarded 3 pointer, which will be a very good outcome for everybody except Westbrook.  A fouled in the act of shooting here would be a three point attempt, 3 points plus one or three free throws.  If that pass had gone to a player like Capela, he would have had to shoot off his secondary (11-44, adjusted) on a Pass To… , his Primary (11-58) on a Pass to Choice, and 11-41 on an assist rating shot.  His inability to shoot threes is very limiting in this ruleset.                

One look at these rules in action and you realize that wing players now have to be able to Shoot Threes and Play Defense, or Shoot Threes and Pass, or have no Secondary and drive the ball and be able to pass at least reasonably proficiently.  You can’t just throw players like Sikma, Silas and Shelton out there at the same time any more in today’s game.   

I'll post a Season Review Later - for now, enjoy the Cards and try the Rules!

Fred Bobberts, Albuquerque, NM 8/21/2022

Saturday, August 20, 2022

"Going Back to Houston, Houston, Houston" - Cards for the 1977 Astro-Bluebonnet Bowl for Strat-O-Matic College Football (Texas A&M and USC)


Chris Stewarts' SOM College Football Cards for the ASTRO-BLUEBONNET BOWL 

Played December 31,1977 in the Houston Astrodome

Cards for 1977 Texas A&M Aggies

Cards for 1977 USC

Link to Other SOM CFB Content on this Blog

Texas A&M (8-3) vs. USC (7-4)

The Bluebonnet Bowl was not where USC and Texas A&M were supposed to wind up. The preseason pollsters figured that USC would win its 23rd Pac-8 championship and Texas A&M its 13th Southwest Conference title. But the Trojans' conference losses to California and Washington and the Aggies' inability to handle Arkansas or Texas precluded trips to Pasadena and Dallas and diverted both teams to Houston. Much the same thing happened in 1975, when the Aggies and the Trojans got the late-season lazies and ended up playing each other in the Liberty Bowl.  USC won that one, 20-0.

Both teams had offenses that were brilliant on occasion, but USC was better defensively and had a definite edge in passing. Rob Hertel's 15 touchdown throws and 1,897 yards broke Trojan records, and Randy Simmrin tied Lynn Swan's career reception mark of 95. Tailback Charles White was a 1,291-yard back, giving the Trojans balance. The defense, featuring Clay Matthews and Dennis Thurman, was the stingiest in the Pac-8 against the run. USC's losses, especially at California and Washington, were a result of offensive lapses; one gets the feeling of a significant opportunity missed with this team.

Part of the inconsistency was due to the fact USC lost 15 men to pro football from the 11-1 1976 team that beat Michigan in the Rose Bowl, including Ricky Bell, Vince Evans, Gary Jeter and Marvin Powell.  Hertel, a second baseman who hit .329 on the Trojan baseball team, stuck around for his senior season at quarterback instead of trying his luck in pro baseball.  Hertel was the best backup signal-caller in the Pac-8; Sophomore Tailback White was “one of the best breakaway threats I’ve ever seen,” according to second-year Trojan Coach John Robinson.  

Complementing white at fullback was Mosi Tatupu, who Robinson says, “is about as easy to tackle as a Coke machine.”  Paving their way was a young, powerful offensive line led by Sophomore Tackle Anthony Munoz and Guard Pat Howell, who Robinson said, “(was)...the best lineman on our team and a potential All-American.”  The coach also rated Wide Receiver Randy Simmrin and Tight End William Gay as All-America candidates.  


Although not overpowering, the Trojan defense led by 4 All-Americans can hold its own against most offenses.  DE Walt Underwood, LB Clay Matthews, CB Ricky Odom and SS Dennis Thurman (all “6” rated defenders) restrict opponents to 3.2 yds/carry (4.0 after sack adjustments) vs. the run and a 48.1% pass completion percentage.   The defense’s biggest strength is they don’t give up a lot of big pass plays—the Trojans limit opponents to 11 yds/completion with only one play over 50 yards all season.


Texas A&M's biggest problem was catching up when it fell behind. The Aggie wishbone was not well suited for passing. Quarterback David Walker threw 107 times for only 749 yards. With more balance, A&M might have lived up to expectations. Certainly, with giant Fullback George Woodard and flashy Halfback Curtis Dickey, its running game was potent. The two backs rushed for 1,107 and 978 yards, respectively. A&M's 3,304 yards left the Aggies only 5.9 yards a game behind Texas as the SWC's top rushing team.


                                 Curtis Dickey gets ready to break one

The key to the Aggie Wishbone was “super-sized” FB Woodard who averaged 4.5 yds/carry (14 TDs) and could keep the chains moving by routinely blasting up the middle and off-tackle for 5-6 yards a clip.  If defenses focused on the inside runs, A&M could pressure the edges by running the option to RHB David Brothers (5.2 yds/carry) and LHB Dickey (5.5 yds/carry, 6 TDs) who was a threat to take it “all the way” on any play.  QB David Walker pulled the trigger for the Wishbone and averaged 3.7 yds/carry (4.5 after sack adjustments).  Although not a strength, the Aggies were able to throw the ball effectively for a Wishbone team, completing 48% of their passes for a healthy 14.8-yard average.  

The Aggies were solid group on defense.  While they had no All-American selections, they did boast 4 All-Southwest Conference (SWC) Team players in DE Phil Bennett, DT Johnnie Donahue, LB Kevin Monk and SS Carl Grulich (all “5” rated).  Although you could occasionally run on the Aggie defense that yielded 3.6 yds per carry (4.3 after sack adjustments), throwing on them could be quite challenging.  A&M only allowed a mere 42.6% completion rate and picked off 17 passes in 1977, averaging 12.4 yds/return.   PK Tony Franklin rivaled Russell Erxleben and Steve Little as one of the best kickers in the SWC and the nation. 

The problem was when the Aggies lost, they lost big: 41-3 to Michigan and 57-28 to Texas. And after the Texas game the Aggies were lackluster in a 27-7 victory over Houston. As for USC, the Trojans closed out their season with an uplifting last-minute 29-27 win over UCLA, which was playing at home for a Rose Bowl bid. 

Both Bluebonnet Bowl teams had momentum, but USC was the more likely to keep it; and they did, Rob Hertel threw for four touchdown passes for the Trojans, while Charles White and Dwight Ford both had 100 yards rushing. The Aggies turned it over five times in a 47-28 USC win.

Enjoy the teams!

Fred Bobberts, Albuquerque, NM, 8/20/2022 (Reprinted with Permission)

Saturday, August 6, 2022

“Bo's Bowl Blues” - (Cards from the 1977-78 Rose Bowl for Strat-O-Matic College Football)


Bo's Bowl Blues - (Cards from the 1977-78 Rose Bowl for Strat-O-Matic College Football)

Dropbox link for Cards for the 1977 Washington Huskies

Dropbox link for Cards for the 1977 Michigan Wolverines

Link to Other SOM CFB Content on this Blog

Oooh this one hurts.  Michigan has had great quarterbacks, guys like Denard Robinson, Tom Brady, and Elvis Grbac, but "Mr. Michigan" was Rick Leach, an All-American four-year starter who even after all of these years is still 11th for the Wolverines in total yardage, 3rd in TDs, and tops in wins with 38. This game was probably Leach's best chance to win a Championship or at least a Rose Bowl. But it was not to be, as Washington rolled them in the first half in Pasadena, and then hung on in the second half. 


Led by Leach, who was a junior in 1977, Michigan began the season ranked second, and were first after four of the first six weeks. However, a stunning 16–0 loss on October 22 at Minnesota dropped them to sixth. A 14–6 win over fourth-ranked rival Ohio State gave the Wolverines the Big Ten title and they came into the Rose Bowl ranked fourth. (Ohio State may have been the better team, actually, but they played the game in Ann Arbor and the Buckeyes just could not hang onto the ball.)


The offensive line, led by three All-Americans (C Walt Downing, LG Mark Donahue and LT Mike Kenn), contributed greatly to Michigan’s three-headed rushing attack which bludgeoned opponents for 4.6 yds/carry.  TB Harlan Huckleby averaged 4.8 yards per carry, FB Russell Davis averaged 4.9 yards per carry, and QB Rick Leach averaged 3.8 yds/carry.  Although the Wolverines didn’t throw a lot, when they did, Leach, completed a respectable 51% of his passes with 13 TDs.  

The Wolverine defense led by All-Americans LB John Anderson and FS Dwight Hicks (both “6” rated players) are a tough group that only allow 2.6 yds/carry.  The Michigan 3-4 alignment created ferocious pressure on opponent passers, which resulted in 39 QB sacks on the year.  However, as we found out in Pasadena, the defense was susceptible to short and intermediate passes, allowing opponents to complete almost 55% of their attempts. 

In their third season under head coach Don James and quarterback Warren Moon, Washington stumbled out of the gate, losing three of their first four games, all out of conference. On Saturday night, Oct. 1, the Washington Huskies were sadly flying home with a 1-3 record. Minnesota had just beaten them on a last-minute field goal, and it appeared that once again their season would be ruinous. They then won six of seven, only losing 20–12 at UCLA on October 29. But with the Rose Bowl on the line at home, UCLA lost to USC in the sort of wild game that keeps traditional rivalries memorable. The Trojans did it when Frank Jordan's 36‐yard field goal with two seconds to play produced a 29‐27 victory.

Warren Moon led the explosive Husky attack that can move the ball effectively on the ground or through the air.  Moon completed an efficient 56%+ of his passes and could throw deep to his speedy target, Spider Gaines (22 yds/catch, 6 TDs) or pick defenses apart with short, surgical strikes.  Washington had a balanced running game with Ron Gibson (4.7 yds/carry) running between the tackles and Joe Steele (4.4 yds/carry and 14 TDs) going outside.  Steele was also an effective receiver out of the backfield (31 catches from the TB position).  The Huskies only had one star (“6” rated defender) on the other side of the ball, All-American LB Michael Jackson, but had a host of role-players that all contributed to create a solid team defense.  Their secondary was adept in picking off enemy passes (16 INTs), which gave their offense a chance to win every game.

The Huskies thus won the Pac-8 title and earned the Rose Bowl berth when UCLA lost that final game. Washington entered the game ranked thirteenth in the AP poll, and they finished tied for fourteenth in the UPI coach's poll.


The astounding climax of this remarkable comeback came January 2, 1978 in the Rose Bowl, where the Huskies upended the heavily favored Wolverines Michigan 27-20. It was the Pacific Eight's eighth win over the Big Ten in the last nine Rose Bowls. And it was Michigan Coach Bo Schembechler's fifth bowl loss in five tries.  Michigan trailed 17-0 at halftime, but they might have been able to make it all the way back in the second half except for Washington's determined defense, which complemented its wide-open offense. On the third play of the second half Wolverine Defensive Back Michael Jolly intercepted a Warren Moon pass on the Washington 36 and took it back to the 11. It seemed Michigan would bull it in and be back in contention.


But with fourth and two on the three, Michigan's Roosevelt Smith gained zero against the left side of the Washington line. The Huskies took over and moved 97 yards in 12 plays, mainly on Moon's passing and Joe Steele's running. Moon, who had been derided by Husky fans for three years, capped the drive by throwing to his favorite target, world-class hurdler Spider Gaines, for a 28-yard touchdown. The extra point made it 24-0, and the Huskies seemed out of reach.  Michigan made a run, but they were intercepted in Husky territory twice late in the game.

With Notre Dame beating top-ranked and undefeated Texas in the Cotton Bowl, Michigan had hopes that a dominant win over Washington would boost the Wolverines to the national title. The Huskies' dramatic upset ended those hopes, and Notre Dame was voted first in the polls among five one-loss teams; Alabama, Arkansas, Texas, and Penn State were the others. Michigan dropped to ninth in the final AP poll and Washington climbed to tenth; both were a spot higher in the UPI coach's poll.


Enjoy the teams - 

Fred Bobberts, Albuquerque, NM (August 2022) Reprinted with Permission