Saturday, December 16, 2023

1967 NFL “Wideboys” Player’s Aids For Strat-O-Matic Pro Football - Original Cards


Travis Williams of the 1967 Green Bay Packers


SOM PRO FOOTBALL LINKS

New! Improved! Analysis Below!

1967 NFL “Wideboy” Cards for Strat-O-Matic Pro Football,

Including Updated Special Teams, Penalties, and Extra Players. It is 115 new sides, about a quarter of the NFL season of new content. I figure if I’m going to replay these, you should be able to, as well. You should be able to print these off Landscape on A4 and while they are not an exact match, size wise, they’ll work for gameplay. 


1967 NFL Players List (Drop Box Link) :


1967Players.pdf


30 extra players, at least one for each team, with some teams having as many as four.  The ‘67 Packers get four: Chuck Mercein, Travis Williams, Max McGee and Don Horn as a third QB. Consult this table for potential block ratings. 

1967 NFL Extra Player Cards (Drop Box Link) :


67NFLExtraPlayers.pdf (32 Player’s Cards in PDF format)


Two extra “records” - Bobby Mitchell and Joe Morrison did not have running cards, and now they do. These are much needed as these men carried the ball quite a bit.  If they are catching passes out of the backfield the * results are incomplete, similar to the Seventies “Greatest Teams” HB/ Receivers.  It should be noted I’ve left some Year One only card quirks in, like the absence of QB double team completions, and certain results where defense right is greater than defense wrong for a few split numbers for runners on teams like Pittsburgh. I figure Hal might have wanted them that way. 


67NFLPuntKickCards.pdf


The original method of carding Field Goals is, to me, unplayable. Towards the late Seventies the Game Co. started to “blend” results if there was a longer range with better percentages than a shorter range, which meant you didn’t have to take a knee to lose five yards to set up a longer kick at a better probability. I will say you can use the old kicking cards with the new plus minus five yard rule and they kick a lot better but these kickers I’ve made can adhere to the bylaws of the time. “Strict Rules of Golf, Goldfinger!”. 


Note that the yardages reflect the 1-12, 13-22, 23-32, 33-42, 43-47 scrimmage lines of the time and you subtract 10 yards from these spots if playing another Wideboy team from 1974 on. 


These cards include penalties, team carding for punts, and kick and punt coverages. I had to crack these for strength of schedule and it took a long time. They are also different than the cards in the updated PC game, as a different model was used there. 


67NFLReturnCards.pdf


A lot of newsprint has been spilled on the 1967 NFL return set and in a sense I add to this. But my methods are at least consistent with my other seasons, and in the case of historically significant return men such as Gale Sayers and Travis Williams I preserve their personal impacts while maintaining the team results by making them number two backs. Williams only returned kicks in seven games because he was a bit fumble prone in pre- season, but if he had two or more returns against you he almost always hit you for 100 yards. Just ask Cleveland. In any case the returns match the coverages and so the overall season should replay pretty accurately. 

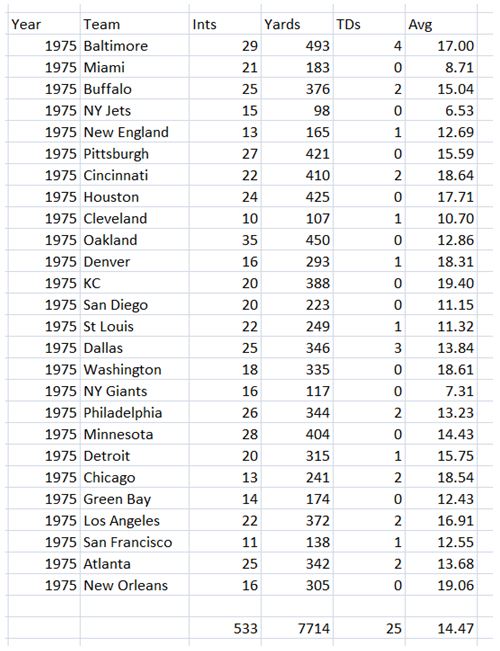
NFL – In general, the 1967 NFL was The Gang That Could Not Kick Straight, as there are a lot of bad kickers in this League.  But they could return kicks, with historic performances from Travis Williams and Gayle Sayers.  1967 Green Bay actually had two historic performances, Travis Williams and his 41 yards per kick return, and only allowing 22 yards in total punt returns, the Pro Football team-season record.  Green Bay also has great kick return coverages, a good kicker (relatively speaking), and good punt returns. 


1967 Atlanta Falcons

Special teams: 

Billy Lothridge is a pretty good punter with no blocks, and Wade Traynham is a pretty average 1967 NFL kicker, 2-7 out to forty yards but only 2-5,11,12 in the 33-42 yd zone; perfect on extra points.  Ron Smith can take a kickoff back for a TD in the 2 spot and KR #1 but he’s a below average punt returner and Mike Fitzgerald isn’t much better as KR #2.  The coverages do not allow LGs but are nothing special, either.

Personnel:

Steve Sloan adds a low-attempt QB, Ron Rector adds 23 useful outside carries at HB, but it is Gary (U.S.) Barnes who adds 10 very useful catches as an extra wide receiver.


1967 New Orleans Saints  

Special teams:

Tom McNeill is a good punter with no blocks, and with their punt coverages he should be among the league leaders in net punting. Charlie Durkee is another average NFL kicker, also 2-7 out to forty yards but only 2-5 in the 33-42 yd zone; perfect on extra points. Kick coverage is below average but neither coverage has a LG. Team is plus 3 on penalties.  The punt returns are terrible, with both returners fair catch prone, the team only got 79 yards in 14 games.  But both kick returners can generate a TD in the 2 spot.

Personnel:

Three functional players are added: Randy Schultz adds 32 useful carries and 14 catches as a FB/HB.  Vern Burke is added as another TE with a block of 1, and John Gilliam adds in 22 catches and 264 yards as an extra wide receiver.     


1967 Baltimore Colts

Special teams:

The Colts far and away have the best penalty card in either 1967 set, plus five.  The kick coverages are average, though, and they allow a LG on kick returns.  David Lee is a good punter, but Lou Michaels is not a great kicker.  He can kick for distance though, 2-5 from 43-47 yards.  Alvin Haymond is a pretty good return man and Rick Volk has TD in the eleven spot as the #2 Punt Returner.

Personnel:

The original Colts did not have a real second TE on the roster, so Butch Wilson is added as a zero catch receiver with a block of 1.  The injured Jimmy Orr gets a card, but will have to wait for 1968 for his true comeback.   


1967 Cleveland Browns

Special teams:

The Browns allowed only 70 yards on Punt Returns for the season, and other than a 12 spot LG the kick returns are good, too. Gary Collins punts a bit short, and he has block, but Groza is not a very good kicker, 2-6,11,12 at 40 yards.  Where the Cleveland special teams crew picks up is on returns, Ben Davis as PR #1 has a 2 spot TD and Carl Ward (KR #2) has a 2 spot TD. Both sets of return men are very good.   

Personnel:

Ron Duncan is added as a zero catch TE with a block rating of 1.


1967 Chicago Bears

Special teams:

The Bears have great coverages and Bobby Joe Green can punt well with no blocks, but Mac Percival, normally a sound kicker for his career, had a tough rookie year.  The Bears also have a lot of fair catches on punt returns, with Gayle Sayers a PR #2 with a TD on 11.  But Sayers is a KR #2 with 6 TD chances out of 36.  The choice to make him a number two return man is debatable, but it is the only way to make the Bears’ team returns work while maintaining his individual averages.  Bears were minus four on penalties.     

Personnel:

Rudy Bukich is a legit third QB, while Andy Livingston as FB adds 28 carries (at 1.4 average) and Bob Jones is an extra wide receiver with a few Long gains (26.8 ypc).  The passes and runs fill in a few gaps for playability. At 37 years old, Bukich would have only 7 pass attempts after 1967.


1967 Detroit Lions

Special teams:

A mess.  I'm likely to replay the Lions and I'm not looking forward to this card.  Lem Barney punts short, and both coverages allow LGs.  Wayne Walker is terrible even by 1967 kicking standards.  They were plus three on penalties, and only miss extra points on 12.  Punt returns are below average, but Tom Vaughn can return kicks reasonably well. The Lions have no returns for touchdowns.

Personnel:

Bobby Felts has a useful HB card, but only ten carries, and John Henderson is an extra WR with 14 catches.  These are helpful fill-in cards.


1967 Green Bay Packers

Special teams:

The Packers have the best all-around Special Teams in the NFL.  While Donnie Anderson punts short and he has a block, he is backed by a historically great coverage team.  The kick coverage is very good too, and Don Chandler is 2-8,11,12 out to 40 yards and perfect on extra points, which would be great for a kicker ten years later.  The punt returns are a bit below average but the Kick Return card houses Travis Williams and his 41.1 yd/return (8 TDs) at the #2 KR spot.  He is the best return man in NFL history. Williams is so good on kick returns that, in 1967, he turned in 1007 all-purpose yards on only 58 total touches.   

Personnel:

Green Bay adds a good backup QB in Don Horn, and WR Max McGee as an extra wide receiver, but the real helpful extras are FB Chuck Mercein and RB Travis Williams, cards that are absolutely necessary for the West Conference Finals.  Green Bay suffered through much the same type of 1967 season as the Jets did in the AFL, they lost their two top runners in the 8th game of the season and had to scramble to fill in carries for these positions:

In the simplest version of the Green Bay depth chart, you can use Mercein to back up Wilson and Williams to share time at HB with Anderson.


1967 Minnesota Vikings

Special teams:

Bob Grim has an 81 yard return as a PR #1 and Clint Jones has a TD on #2 as a KR #1.  Kick Coverage is very good, and punt coverage is very very good.    Bobby Walden is an average punter for distance but has no blocks.  Fred Cox is a solid kicker for the time, 100 percent on extra points and 2-7,12 out to 40 yards.  Minnesota is probably second in 1967 NFL special teams, a big reason they won their division.

Personnel:

Only extra Viking is Jim Lindsey is a HB with 8 touches.


1967 Los Angeles Rams

Special teams:

Bruce Gossett did not have a great year, dropping to 2-5,12 from the 23-32 yard line, although he makes all of his extra points.  Jon Kilgore has good punt yards, but he does have a block.  Punt coverage is average, but the Kick coverage is better than average, even with a LG.  Both punt returners and kick returners are above average.  The Rams were plus four on penalties.  For 1967, this is a decent card, top four.   

Personnel:

Only extra Ram is Jim Stiger, a HB with 3 touches.


1967 San Francisco 49ers

Special teams:

Tommy Davis can hit 50-yard FGs but on the whole his 1967 kicking effort is not up to his usual efforts.  Their punt return coverage is above average, but the kick coverage isn’t, and both types of coverages allow LGs.   Steve Spurrier punts short and has a punt block. Flip the card over and Doug Cunningham is a good punt returner and kick returner, and Bill Tucker as a KR #2 is also solid.

Personnel:

The Niners add a third QB with 50 attempts in Steve Spurrier, and a 1 rate blocking TE in Dave Olerich.


1967 New York Giants

Special teams:

Ernie Koy punts shorter, and he has a block, and the opponent punt returns are poor, making the Giants among the poorest net punters.  The kickoff coverage is a little better, but still has a LG.  Pete Gogolak is a pretty average place kicker, 2-7, 12 out to 40 yards but only 2-10 on extra points. The Giants get a lot of Fair Catches in their punt returns, and the kick returners are below average.     

Personnel:

New York’s Joe Morrison was a phenomenal all-around player, and to his existing receiving card this set adds 36 helpful carries as a HB.  (He was carded only as a receiver on the original cards, and similar to the Greatest Teams set from the mid Seventies his receiving card has catches that are qualified based on whether he is a RB or WR).  As a WR he has a block rating of 1.  Allen Jacobs adds 11 carries as a sub FB.   


1967 Washington Redskins

Special teams:

Gene Mingo is quite possibly the worst kicker in the NFL, 2-10 on extra points and only 2-5, 12 in the 13-22 yd range.  Punt return coverage is average while kickoff coverage is below average with a Long Gain. Pat Richer is average on punts but with no block.  Their punt returns are below average, and kickoff returns are pretty average, with John Love at KR #2 having a TD on #2.  

Personnel:

Washington adds two running backs, Joe Don Looney (FB/HB, 12 touches) and Steve Thurlow (FB, 23 touches), and John Burrell (WR, 9 catches).  But the most helpful card is a running card for WR Bobby Mitchell (He was carded only as a receiver on the original cards, and similar to the Greatest Teams set from the mid Seventies his receiving card has catches that are qualified based on whether he is a RB or WR).  Mitchell adds a full 61 carries to the Washington slate.

1967 Philadelphia Eagles

Special teams:

 Sam Baker is the punter and kicker for the Eagles, and as a kicker he was 2-8,12 inside 40 yards (75%) which is pretty good even for the mid Seventies.  He punts a bit short and he has a block, but the punt Eagles coverages are very, very good.  Kickoff coverage is very poor, with high yardages and a LG.  The Eagles returns are below average.  Baker makes this a card you can live with.  

Personnel:

Ron Goodwin (WR) has a decent extra WR card.


1967 Dallas Cowboys

Special teams:

Bob Hayes has a punt return TD and Craig Baynham is a very good KR #2, but the Cowboys are a very good team with sub-par special teams.  They don’t give up a LG on coverages but their yardages are below average, and Danny Villanueva is an average punter and below average place kicker.

Personnel:

3rd QB Jerry Rhome added with 18 reasonable attempts.


1967 St. Louis Cardinals

Special teams:

Jim Bakken is very good in close and makes all of his extra points.  Chuck Latourette is an average punter with no blocks.  Their punt returners and kick returners are nothing special.  The coverages are actually pretty good in spite of LGs on both PR and KR. The Cardinals are probably third in special teams, buoyed by Bakken in close.

Personnel:

Ted Wheeler added as a 1 blocking TE.


1967 Pittsburgh Steelers

Special teams:

Mike Clark is a bit erratic but he is 2-6, 12 out to 49 yards and he makes all his extra points.  Like the Cardinals the Steelers have decent coverages, but also give up 12 spot LGs both ways.  Jim Elliott punts a bit short and has a block.  Both kick and punt coverages are pretty good, though, and so are the returns.

Personnel:

Pittsburgh adds Dick Hoak, a 52 carry HB albeit at a 2.7 yard/pc average.  Hoak also had 17 catches. 


Fred J. Bobberts 

Original Date of Publication: December 16, 2023

Sunday, April 23, 2023

Fred’s Fabulous Field Goals Chart (For Strat-O-Matic Football)


Tom Dempsey

To determine pct chance of a good FG at every yard line and for use with recent Strat-O-Matic Football FG modifiers rule.

Freds_Fabulous_Field_Goals_Chart.xlsx

SOM PRO FOOTBALL LINKS

The way you use this is to open the “Template” sheet. You’ll see the set up for 1975 Tom Dempsey. You put the equivalent for the longest yard line in modern terms in field E4, in his case 37 yard line. Now for reference I like to put the ranges into B14:B18 and the chances/36* 100 in C14:C18.   From column E, you can see Dempsey becomes a 56.8 pct kicker at the modern (1974 on) 31 yard line in, a 48 yard kick. For him we use column F, the modern column.  He’s an 80 pct kicker from the 13 in, 30 yard kick. That doesn’t sound brilliant until you look at other 1975 kickers. He misses a lot of extra points but he’s still a weapon in that starved points environment. 

On the “1957 Bobby Layne” tab we see Layne becomes a 50 percent kicker in his season from his 30, a 37 yard kick now checked from Column G. The pole was on the goal line for 1957 so kickers pick up ten yards in range.  Layne makes at least 2/3rds of his kicks from inside 30 yards (22 yard line in 1957). That’s better than you’d think back then. (Note you still use 37 yd line for Layne’s carded longest yard line on the sheet.)

There are two modern kickers, both Jason Hanson seasons, and they really show the differences even modern kickers can make. You’ll note Hanson’s longest are now 39 yard lines, reflecting his longest kicks were 56 yards. 1995 was a middling poor year for Hanson and he only crosses 50 pct at the 27 yard line, or a 44 yard kick.  He’s over 90 pct at that distance as an All-Pro fourteen years later. 

The Tom Dempsey comparison tab shows 1975 versus 1976.  Dempsey was rated 2-10, 2-7,12, 2-8,11,12, 2-7,12, 2-3 in 1976 and even with smoothing you get a feel for his inconsistency at range.  (They did this for a number of years on the old cards).

1976 Dempsey will make roughly 2/3 of his kicks inside the 15 and 3/4 out to the 22. He drops to 52 pct at the 30 and he lacks the strength to kick much farther than 50 yards; in 1975 he had leg enough to hit at 52 yards. Amazingly enough he’s still a top ten kicker in 1976, but he’s not quite the weapon he was in 1975. 

Enjoy!

Fred Bobberts, Chandler, AZ

Initial publication date: April 23, 2023


Chances: 

 2   1/36*100

2-3   3/36*100

2-3,12 4/36*100

2-4  6/36*100

2-4,12 7/36*100

2-4,11,12 9/36*100

2-5  10/36*100

2-5,12 11/36 *100

2-5,11,12  13/36*100

2-6 15/36*100

2-6,12 16/36*100

2-6,11,12 18/36*100

2-7 21/36*100

2-7,12 22/36*100

2-7,11,12 24/36*100

2-8 26/36*100

2-8,12 27/36*100

2-8,11,12 29/36*100

2-9 30/36*100

2-9,12 31/36*100

2-10 33/36*100

2-10,12 34/36 *100

2-11 35/36*100


Tuesday, April 11, 2023

On Strat-O-Matic Football Rosters and Schedules


On Strat-O-Matic Football Rosters and Schedules:

SOM PRO FOOTBALL LINKS


Since it came up again on the Forum:


Question came up why Dick James (who led the team in ints with 3) is not listed as a cornerback for the 1959 Washington Redskins. Most DBs of that era were strapping guys who played in run support; James was 5 feet 9 and 179 pounds, most sources including PJ Troup have seven DBs listed as starters for the four defensive backfield positions and James is not one of them. 


I think I got it right in that Ben Scotti Gary Glick, Doyle Nix, and Dick Haley all had 8 or more starts, and Richie McCabe and Chuck Cichowski both started some.  Bill Stits played for two teams in 1959.  but In general I try to place at least two sub DBs on the card so the team is playable, but I don’t try to have every player who made a play carded.  That’s a baseball thing, in football we are trying to get playable rosters over some arbitrary goal of completeness.  


Simply put, there is no requirement that I’ve heard that stipulates every player who made a play needs to be carded at every position.  This action has not been performed for most if not all seasons we have made; it would be a heckuva data check to have to try this for all the seasons we have carded.  The effort would not be, in the parlance, a piece of cake. 


In the case of the 1959 Redskins they were manifestly horrible against the pass, turning the Fifties quarterbacks they faced into 1976 Bert Jones on the aggregate, so it should be obvious that any additional backs that were uncarded should be zeros. 


A few observations….


SOM rosters, like the game itself, are an abstraction. While every effort is made to have them be 100 percent accurate what I see on the internet is not always the best interpretation. To me nothing beats film, or contemporary accounts from newspapers of the time; there’s less of a filter there. 


Even in the case of data I have, I still have been known to flip defenders or receivers  on occasion when I know they did this to promote positional balance across a season. You don’t need to do this for 1980 with all those teams, but sometimes you need to make a split end a flanker to balance the position across only twelve teams.  I’ve made TEs TE/SEs where it made sense to card as such, and I’ve made HBs SE/FLKR as well to fill out positions. I try to be consistent, and it helps to have worked surrounding seasons.


In short SOM Football rosters are not intended nor were they ever intended to be archival repositories of NFL History, they were intended to support our gameplay. And as such some hard decisions need to be made to make that work.  


Same with schedules.  One of the quirks of the league utility is the play next week feature. On occasion (although it is thankfully rare) some games need to be moved a day one way or the other in the schedule to make this feature work.  I would say this happens once or twice in a season when it happens at all, and maybe in every other season or so in the Seventies. People post on these all the time, and the answer usually is we tried the historical schedule and the autoplay threw an error. So we had to adjust this timeline somewhat. The SOM schedule is not meant to be the NFL historical record, it is meant to ensure teams play the right opponents and the right games, hopefully in the right order. (That I don’t think I ever changed.)


Same with QB schedules. Now I get into a lot of trouble when I mention I don’t go with the starter as the starter in our file 100 pct of the time. In the case where attempts are split I might look at the season and the fraction of attempts the QBs had. We can’t rotate QBs by drive so my goal would be to realistically split the work by the right opponents for each QB on the roster.  I make QBs versus their opponents and vice versa, so the QB schedule is absolutely critical especially in a smaller season. 


A good example might be the late Fifties Giants where they used Don Heinrich as a “starter” in 10 games but he would usually play part of the first quarter to give Charley Conerly a better look at the defense from the sidelines. Heinrich usually only had a small fraction of attempts, so I might give him starts in the games where he has the most attempts. This scheduling of a “starter” is not reflective of NFL history, but it’s reflective that Conerly actually played the most in most of these games. In order for the results of seasons to work you have to give Conerly the starts he needs to get attempts against the defenses he faced. Thankfully gamers can change the Qusrterback schedule, but it still causes some angst. 


-Fred

Saturday, February 11, 2023

"Sixty-Two" Cards for the 2022 American League for Statis-Pro Baseball


 Cards for the 2022 American League for Statis-Pro Baseball

Statis-Pro Baseball Cards - Not Normalized 2022 American League

Statis-Pro Baseball Cards - Normalized 2022 Americal League

Other Links to Statis-Pro Baseball Content

With one season, AL MVP Aaron Judge went from a very good player to having a legitimate shot at the Hall of Fame if all continues to go well.  With all the good that happened for him - a shot at the Triple Crown, a final .311 batting average, 111 walks, 133 runs scored, and 131 RBIs to go with an American League record 62 Home Runs the one accomplishment he just missed, to me, would have been the most impressive. Judge finished with 391 total bases and narrowly avoided being the first AL player to top 400 bags in a year since Jim Rice had 406 in his big year in 1978.  The NL has seen this threshold crossed several times in that interval, but the next AL 400 total base season will still have to wait, 44 years and counting.  

With 62 HRs in 2022, Aaron Judge sits at 220 homeruns at the age of 30.  When healthy 40 homers a year seems a cinch at Yankee Stadium, which is why I was glad when he re-signed with New York.  Hitting in New York, Judge should pass 500 homeruns in seven years; 600 by age forty is a distinct possibility.  If you play well in the outfield, as Judge does, and you hit 500 plus homeruns while playing in New York, acting as the Yankee Captain and, perhaps, possibly playing only as a member of the Yankees, you are going to the Hall of Fame.  The Pantheon outcome may seem like a given for him regardless, but Judge had injury shortened partial seasons in 2018 and 2019, and the Covid-19 shortened season in 2020.  He's lost a lot of time in his prime.  Had he gone to LA, for instance, and batted .280 with 30-35 homers a year, I think he would have cut his Hall of Fame chances by 30 percent. Aaron Judge is a very, very thoughtful and intelligent player, and it's encouraging to see a man of his potential show the awareness he has of his possible place in baseball history.  

For quite a few teams in the American League, 2022 was the Year of The Tank.  Oakland (60-102), Kansas City (65-97), and the Rangers (68-94) were teams in full rebuilding mode, but it could be argued Detroit, Minnesota, the Angels and the Red Sox were also looking more at the future than the present.  Oakland finished 14th in runs scored and 13th in ERA and was thirty games under .500 by July 11.  During the season Oakland traded their best starter, Frankie Montas, and in this offseason they traded their best player, 2021 Gold Glove catcher Sean Murphy.  Like a number of small-market teams, Oakland pins their hopes on a deep young bullpen and great defenders who might not swing the bat well, guys such as Tony Kemp (2B), Nick Allen (SS) and Cristian Pache (CF).  This year, American League rosters had a lot of these inexpensive sub-.220 type hitters with great gloves.  

The new structure of the League also promoted this tendency.  In the 1970s teams would have fifteen or sixteen players and nine pitchers with four starters; modern baseball features two catchers, six infielders, five outfielders and thirteen pitchers with up to six starters.  The roster limit of 13 position players, extending as it must to include a DH, imposes the need for two or three multi-position fielding stars to cover for injuries and pinch-hitting.  Just about every team has at least one talented multi-position player like this, the prototype is the Yankees' DJ LeMahieu. who fields brilliantly at first, second and third base, but all teams try to find a guy who can play like this. 

Kansas City pitchers Brady Singer (10-5, 3.23 ERA) and Scott Barlow (7-4 24 Saves, 2.18 ERA) with a couple plus defenders in C Salvador Perez and CF Michael A. Taylor, some good team speed (104 SB 3rd int the league), and a nifty young 20 HR / 30 SB player in rookie shortstop in Bobby Witt. Witt can raise his ceiling if he can improve his on base percentage and glovework, but since he was only age 22 and with 57 extra bases at shortstop, he likely has some good years ahead of him.  The Royals had some good players to build around but lacked depth is the starting rotation.

The Tigers were not exactly tanking in 2022, in spite of their 96 losses, at least not on purpose. In the 2021 offseason they traded for defensive catcher Tucker Barnhart and signed Javy Baez to bolster their lineup, but nobody including "El Mago" could hit a lick in the first 64 games, as the Tigers started 24-40.  Baez was often the most exciting player on both sides, as he finished in the rare 25-25 club- 25 walks and 25 errors.  The Tigers had hoped to contend but their offense severely declined in spite of the ageless Miguel Cabrera, who tallied his 3000th hit and superb part timers in IF Harold Castro and C Eric Haase.  The Tiger pitchers actually saved the season, with Tarik Skubal, Matt Manning, Gregory Soto and a rejuvenated Joe Jiminez leading the charge to an 11th place finish in ERA, with Detroit closing the season at 15-11 in the last month.

The Rangers (68-94) smacked 198 HRs, good for 4th in the league, and totaled 128 stolen bases, topping the AL. Texas had seven players in double figures for dingers and five players in double figures for steals, the start of potentially a nice future lineup. C Jonah Heim, 1B Nathaniel Lowe, 2B Marcus Siemen, and SS Corey Seager formed the core of an infield much better than one would expect for a team with only 68 wins.  Starter Martin Perez finished 12-8 with a 2.89 ERA, but the rest of the starters fared poorly; you know it's a tough year on the mound when a team takes a chance on Dallas Keuchel who is sporting a "Porsche" ERA line (9.20) in a year when his cutter is no longer cutting. The Rangers could use help in the outfield, the bullpen and at least two starters but their rebuild is off to a decent start.

How did the Angels win only 73 games while rostering two of the game's best players, Shohei Ohtani (9.6 WAR) and Mike Trout (6.3 WAR)?  They also had another good player in rightfielder Taylor Ward (0.281, 23 HR) and second starter Patrick Sandoval (2.91 ERA).  Ohtani finished 15-8 with a 2.33 ERA and he fanned 219 batters, while at the dish he spanked 70 HR (34 HR), scored 90 runs, and drove in 95 RBI.  Ohtani simultaneously finished 4th in the league in Home Runs and also 4th in the Cy Young balloting as the league's best pitcher, a remarkable feat.  The problem is the Angels started four players who batted less than .230, and their bench was almost completely below replacement level.  The Angels finished 6th in the League in ERA in spite of a lack of a proper stopper, but the team slumped to 623 runs scored (13th in the League).      


Shohei Ohtani

Two "Fallen Contenders" each finished 78-84, the Minnesota Twins, who won the AL Central as recently as 2020, and the Boston Red Sox, who had played in the ALCS in 2021.  Both had met the same fate in their respective seasons, perishing at the hands of the Houston Astros.  

On Sept. 4, 2022, the Twins held a share of first place in the American League Central. On 9/23/2022, they fell out of the division race altogether.  It had been a stunning fall from the top for the club that held at least a share of first place in the division for all but one day from April 24 to Aug. 8, with the Twins maintaining throughout the struggles of the late summer that once their key players were able to come back healthy, and once they played to their potential, they’d be ready for a real push to the playoffs.  After losing 4-2 to the Angels on that Friday night, they had now dropped five in a row, eight of their previous nine, and 17 of their past 23. A little over a week prior, they controlled their destiny as they headed to Cleveland for a five-game series with a four-game deficit.  But they lost seven of eight to the Guardians during that stretch, and by late September, they were out of the Central race. Down the stretch they finished 11-23.  The Twins featured a productive infield of 1B Jose Miranda (.268, 15 HR), 2B Jorge Polanco (.347 OBP, 16 HR), SS Carlos Correa (.291, 22 HR) and Gio Urshela (.285, 13 HR), and DH Luis Arreaz pipped Arron Judge for the batting crown at .316.  Joe Ryan won 13 games (3.55 ERA and Sonny Gray finished 8-5, but the team suffered from Emilio Pagan's fall from grace, as he blew 7 saves and finished 4-6 (albeit with 9 saves) and a 4.43 ERA in his return to the American League.  The big loss for the Twins was All-World CF Byron Buxton, who battled injuries all year long and could only play 60 games in the outfield. Buxton swatted 28 home runs in 92 games but his brittleness is concerning enough that even though he is a five-tool type player the Twins brought in Michael A. Taylor, a second brilliant centerfielder in this offseason to back him up.  


Byron Buxton - A Very Dangerous Player When Healthy

For the Red Sox, after finishing two games from the World Series in 2021, multiple times throughout the next season key players underperformed and injuries throughout the roster derailed their season.     After compiling a 23–27 record through the end of May, the team went 20–6 during June, only to fall back under .500 in the second half of July. Injuries to multiple players and roster challenges, including a lack of offensive production at the first base position, hampered the team.  On July 22, the Red Sox suffered a historic 28–5 home loss to the Toronto Blue Jays. The 28 runs set a new Red Sox franchise record for the most runs ever allowed in a single game.  The team went 8–19 during July, falling into last place in the AL East and ending the month with a 51–52 record.     


The Bosox Defense Failed to Take Wing in July

Still, there were some bright spots in the Fenway firmament. When healthy, Trevor Story at second joined Xander Bogarts at shortstop (.307, 15 HR, 84 R) and Rafael Devers (.295, 27 HR, 88 RBI) at third to provide a solid infield combination.  Ageless J.D. Martinez swatted 60 extra base hits in 139 games at DH, good enough to make an All-Star appearance.  Michael Wacha anchored an indifferent starting corps with an 11-2 record and 3.32 ERA; the Sox were left to ponder what might have been if Chris Sale (5 IP) and Nathan Eovaldi (109 IP) had been healthy.  Tanner Houck, John Schreiber and Garret Whitlock showed promise in a crowded bullpen, but could not take the place of 2021 closer Matt Barnes, who stumbled to 0-4 with only 8 saves.

The Chicago White Sox had won 93 games and the AL Central in 2021 behind a stout five-man rotation of Lucas Giolito (11-9, 3.53 ERA, 201 K), Dylan Cease (13-7, 3.91 ERA, 226 K), Dallas Keuchel (9-9, 5.28 ERA), Lance Lynn (11-6, 2.69 ERA), and Carlos Rodon (13-5, 2.37 ERA, 185 K) and bullpen ace Liam Hendriks (2.54 ERA, 38 saves).  As a group the starters were 57-36.  Of this group Cease followed 2021 with a 14-8, 2.20 ERA, 227 K season that placed him second in the 2022 Cy Young voting, and Hendriks saved 37 games, but Lynn and Giolito finished 19-16 and Johnny Cueto, brought in to replace Rodon, pitched decently but could only manage an 8-10 record.  SS Tim Anderson batted .301 and stole 13 bases but could only play in half the team's games; 1B Jose Abreu (.304, 85 R) saw his 2021 home runs cut in half to 15, and C Yasmany Gandal batted only .202 with 5 HR after hitting .240 with 23 HR in 2021.  One nifty surprise was the return to form of DH Eloy Jiminez, who batted .295 and bashed 16 HR in half a season's work at DH, but as a team the White Sox scored 110 fewer runs than in 2021 and allowed 81 more, and their 81-81 finish cost Tony LaRussa his job.


A case could be made for White Sox Ace Dylan Cease as the AL's best pitcher

The Baltimore Orioles (83-79) had the misfortune of playing in the American league's toughest division, or perhaps their young and emerging lineup might have cracked the playoffs.  Talented fielders such as C Adley Rutschman, SS Jorge Mateo, Gold Glove 3B Ramon Urias, and outfielders Austin Hays and Cedrick Mullins all could also swing the bat, and RF Anthony Santander hit 33 HR and drove in 89 runs. All of these players were 28 or less years old, and every position had a player who hit HR in double figures in 2022.  Jorge Lopez (1.68 ERA, 19 saves) and Felix Bautista (2.19, 15 saves) could nail down the late innings, but the rotation was a work in progress, with only Jordan Lyles (12-11, 4.42 ERA winning in double figures.  Still, the Orioles 31 game improvement brought the city of Baltimore their first winning season since 2016. 


Adley Rutschman

The Tampa Bay Rays won the AL East and the AL Pennant in 2020 and 100 games and the AL East in 2021 using the same tried and true formula in their ballpark - timely hitting, superb fielding and talented pitching, with four good starters backed by a deep and quality bullpen. 2022 was no exception, although the results on the field reflected the impact of injuries on the roster. The team's top two home run hitters, Mike Zunino and Brandon Lowe were sidelined by injuries, and the team also lost 2021's most dynamic all-around player, Wander Franco.  Pitchers Nick Anderson, Yonny Chirinos, Tyler Glasnow, Brendan McKay, Jaleen Beeks, Colin Poche, Ryan Thompson, Shane Baz, Chris Mazza, JP Feyereisen and Pete Fairbanks all missed significant time.  The team lost 928 player days to injury, but still won 86 games (versus 76 losses) because they still could do what they've always done well - capitalize on other team's mistakes.  They snagged Isaac Paredes, a 23 year-old infielder who had been unproductive with the Detroit Tigers, and while his .205 batting average was nothing to write home about his 20 HR in only 111 games sure helped the Rays' lineup up after the team lost Brandon Lowe.  They also received a useful replacement outfielder from Arizona in David Peralta and a brilliant defender in CF Jose Siri from the Astros.  Their starters were dangerous- if two-time Cy Young Award winner Corey Kluber had an off year at 10-10, 4.34 ERA the team still featured lefty Shane McClanahan (12-8, 2.54 ERA), Drew Rasmussen (11-7, 2.84 ERA) and Jeffrey Springs (9-5, 2.46 ERA).  Their pitching and resilience always makes the Rays dangerous in the playoffs, and so they were in the wildcard round, with a 1.23 ERA in 22 innings pitched.  That was not enough, however, as they were defeated by perhaps the one team constructed to do so in the American League. 

That team, the AL Central Champion Cleveland Guardians (92-70), beat the Rays 2-0 in the wild card round 2-1 in Game 1 and 1-0 in 15 innings in Game 2.  This outcome was absolutely indicative of each team's pitching and fielding depth and toughness.  If the Rays were usually the American League's preeminent defensive squad it was the Guardians' turn in 2022.  Cleveland put P Shane Bieber, 2B Andre Gimenez, and outfielders Steven Kwan and Myles Straw on the Gold Glove team, but C Austin Hedges would not have been out of place on the list and SS Amed Rosario was perhaps the team's most improved player.  This talented lineup featured five players in double figures in home runs, led by Jose Ramirez's 29 HRs and 126 RBI (and 20 steals); and five players with 18 or more stolen bases, led by Myles Straw's 21.  Straw was caught only once; the team on the whole stole 119 bases (2nd in the AL) and was caught only 27 times.  Bieber (13-8, 2.88 ERA, 198 K), Triston McKenzie (11-11, 2.96 ERA, 190K), Cal Quantrill (15-5, 3.38 ERA) and hard throwing right hander Aaron Civale, who dropped from 12-5 in 2021 to 5-6 in 2022 all rotated ace starter duties, while the bullpen featured the unhittable Emmanuel Clase, who saved a league leading 42 games while allowing a .167 batting average.  Trevor Stephan and Sam Henges also backstopped Clase, whose 2022 ERA was only .1 runs/ 9 innings lower than his career ERA.  Cleveland's win over Tampa put them on a collision course with New York at the divisional level, and they took the powerful Yankees all the way to the fifth game before home runs by Giancarlo Stanton and Aaron Judge finally stopped them.


Not much dropped between Steven Kwan and Miles Straw in Cleveland in 2022

The other feel-good story for 2022 in the American League belonged to the long-suffering Seattle Mariners, and their fans.  Fans of "Dorktown", the YouTube channel that features Jon Bois will remember the Mariners annual pratfalls; the team had not made the playoffs since 2001, the year they set the AL record for wins but lost to the Yankees in the ALCS.  That was probably their last best chance to make it to the World Series.  The 2021 Mariners won 90 games, but no bananas, as New York and Boston each won 92 to take the Wild Card spots.  This year's team experienced the highs and lows of a thrilling pennant race- a 9-18 May ended any hopes for the West Division, and on June 21 they stood 30-39.  They promptly won 8 of 10, lost a game, and won 14 in a row to make the playoffs a possibility.  A 4-9 stretch in late September brought back nightmares of past season el-foldos, but the Mariners won 7 of 9 down the stretch, including four walk-offs.  Seattle finished 14th in the AL in hitting at .230, but they did have eight players in double figures in homeruns (led by 21-year old ROY centerfielder Julio Rodriguez, who hit 28 HR and batted .284, and Eugenio Suarez, who hit 31 HR and led the team with 87 RBI) and totaled 197 dingers.  All that home run hitting helped, but pitchers Robbie Ray, Logan Gilbert and mid-season NL acquisition Louis Castillo also appreciated the glovework of shortstop J.P. Crawford and a tough bullpen led by Paul Sewald (20 saves), Pen Murfee, Andres Munoz, and Erik Swanson, who finished a combined 19-14 with an ERA less than 3.00.  


Jon Bois and Alex Rubenstein's classic "Dorktown" explored the exorcised Ghosts of Seattle's Baseball Past 

The Mariners opponent in the Wild Card round was the AL East's second-best team, the Toronto Blue Jays.  A powerful and talented lineup, Toronto topped the American League in batting, on-base percentage slugging, and total bases, smashing 200 HR and 307 doubles and finishing a narrow second in runs scored.  First baseman Vladmir Guerrero, Jr swatted 32 HR and drove in 97 HR and won his first Gold Glove, while his partner on the other corner Matt Chapman also won a Gold Glove and hit 27 HR with 68 walks.  Centerfielder George Springer and rightfielder Teoscar Hernandez each hit 25 HRs and shortstop Dante Bichette hit .290 with 24 HRs.  The powerful lineup supported a troika of three solid pitchers, including ace Alex Manoah (16-7, 2.24 ERA, 190 K), Kevin Gausman (12-10, 3.35 ERA) and Ross Stripling (10-4, 3.01 ERA), with Jordan Romero closing 36 saves out of the bullpen (2.11 ERA).  Toronto had a lot of the qualities of a championship team, so it was a bit of a surprise when Seattle's Castillo shut out the Jays' Manoah and his team in Game 1.  The Blue Jays seemed to have righted the ship in Game Two, as C Alejandro Kirk and 2B Santiago Espinal each hit absolute moonballs off Mariner starter Robbie Ray; Toronto led 8-1 after 5 innings.  This was the last good moment of the game (and the season) for the Blue Jays, as the Mariners immediately struck for 4 runs in the sixth against Gausmann and his replacement, Tim Mayza, including a 3 run big fly from Carlos Santana. 


Vladimir Guerrero, Jr.

Trailing 9-6 in the eighth, Crawford drilled a game-tying bases-clearing double with the bases loaded off Romero, and Adam Frazier doubled in the game winner off Romero for Seattle an inning later. It was a tremendous playoff coup for Seattle, and it earned them a trip to the Divisional Series against the Houston Astros.  That game washed away many postseason sins for the Dorktowners.  But miracles can happen against anyone but the 2022 Astros, and while Seattle pushed them to 18 innings in Game Three, the series outcome was a 3-0 sweep for Houston, and an ALCS matchup with the Yankees.         

The Yankees were three teams in 2022.  Early in the season they looked like the best team in baseball, and they stood 52-18 on June 23rd having beaten Houston 7-6.  But cracks started appearing in the lineup and in the bullpen, as the Yanks lost reliever Chad Green, outfielder Joey Gallo, and versatile infielder D.J. Lemahieu within a span of weeks of each other in May, and then shut down lefty closer Aroldis Chapman due to tendonitis and right-handed reliever Jonathan Loaisiga for shoulder inflammation.  The Yankees had been a deep and talented team, and they continued to struggle along, albeit not at their prior .700-plus pace. Once Giancarlo Stanton landed on the DL, though, the losing trickle turned into a rout.  New York whipped Boston 13-2 on July 17 at 64-28 to land at the All-Star Game comfortably in first place, but they promptly started 7-12 after the All-Star break to put the '78 Red Sox level Fear Of God into the Bronx faithful.  At first no move seemed to work - they traded for .300 hitter and all-star left fielder Andrew Benintendi in late July (at this point only Judge was an all-around starter in the outfield) only to lose him in early September; they traded for Oakland hard-luck pitcher Frankie Montas only to see him post a 1-3 record with a BMW coupe level ERA (6.35) in New York; and Matt Carpenter, who actually hit better than Judge in 47 games of limited duty, was lost for the regular season on August 8th with a foot injury and endured a terrible postseason.  

It was a move that was widely panned at the time that saved the Yankees' Third Season.  After the Montas trade they traded Jordan Montgomery to the Cardinals for the then-injured Gold Glove centerfielder Harrison Bader.  While Bader was in a walking boot in mid-season, Montgomery's fastball looked like Bufferin in St. Louis, which made the deal look like a bad trade.  But by late August New York was trying anyone who was healthy in the outfield, and once Giancarlo Stanton came back from the DL and Bader was available to move Judge back to right, the Yankees established their playoff identity.  Bader hit an even .300 with 5 HR in the playoff against Cleveland and Houston. At times during the postseason, Bader was one of the few New Yorkers who showed signs of life at the plate. 

Focusing now on what went right, well, you start with Judge, who successfully chased the American League home run record all season, and he held together the top of the lineup, batting anywhere from leadoff to third.  Smooth fielding first baseman Anthony Rizzo was second on the team with 32 HR and 77 runs scored, and trusty second baseman Gleyber Torres hit 24 HR with 76 RBI.  Catcher Jose Trevino won his first Gold Glove and held down the backstop spot.  Stanton hit only .211 but hit 31 HR in only 110 games; the Yankees led the AL in runs scored (807) and home runs (254).  This lineup supported a great starting rotation, with Gerrit Cole (13-8, 3.50 ERA, a league-leading 257 K) and "Nasty" Nestor Cortes (12-4, 2.44 ERA) as headliners, Jameson Taillon went 14-5, and Luis Severino, while restricted somewhat, finished 7-3 with a 3.18 ERA.  In Chapman's absence, Clay Holmes (20 SV, 2.54 ERA) led a talented bullpen with the nifty Wandy Peralta (56 G 2.72 ERA) filling in nicely.  New York finished 20-9 in the last month to win the East handily, and then dispatched the playoff-built Cleveland Guardians in the Divisonal round.  But miracles can happen against anyone but the 2022 Astros; the Yankee interior defense and team offense both unraveled in the ALCS, and NY got swept 4-0.


Gerrit Cole, Ace for Hire, topped Ron Guidry's NY 1978 season strikeout record with 257  

Unless you are from Houston, odds are the Astros are not your favorite team; they just have too much history.  This is a shame- they have won their Division in five of the last six years; they made it to six straight ALCS, won four of them, and 2022 was their second World Series Champion.  They won 106 games in 2022 and they were clearly the best team in the American League.  If New York had four good starters the Astros did them one and a half better, with five men winning in double figures - Framber Valdez (17-6, 2.82 ERA), Justin Verlander (18-4, 1.75 ERA), Jose Urquidy (13-8), Luis Garcia (15-8), and Christian Javier (11-9, 2.54 ERA), with injured Lance McCullers, Jr. (4-2, 2.27 ERA) and his wicked curveball googly waiting in the wings for the post-season.  Valdez won 17 and led the league in innings pitched while finishing fifth in what might have been a classic Cy Young campaign in years past, but teammate Verlander won the ERA crown, and another Cy Young, his third, finishing at 1.75, and might have had a shot at twenty wins had a late season calf injury not cost him six weeks of the season between late August and mid-September.  Only eleven men have won three or more Cy Young Awards.  With Ryan Pressly (33 SV, 2.98 ERA) and Rafael Montero (14 SV, 2.37 ERA) headlining a talented bullpen the Astros led the American League handily with a 2.90 ERA.

With that much pitching they didn't need to hit much to win, but hit they did, finishing third in the AL in runs scored and second with 214 homeruns. Houston was the only team to place two men on the Silver Slugger team, ageless second baseman Jose Altuve, who hit .300 with 28 HR, stole 18 bases while being caught exactly once, and scored 103 runs, and DH Yordan Alvarez, who was even better, batting .307 with 37 HR while driving in 97 runs.  They were backed by Gold Glove right fielder Kyle Tucker's 30 HR, 25 SB and 107 RBI, and 3B Alex Bregman's 23 HR and 93 RBI.  Even the shortstop, Jeremy Pena, got into the act, hitting 22 HR and winning the Gold Glove at only 24, and then following these contributions with an ALCS MVP and a World Series MVP award in the same season. Only eight men have done this in Major League history, the last had been Livian Hernandez, who was also a rookie when he turned the trick for the Marlins in 1997.  


The heart and soul of the Astros, Jose Altuve is a tiny time pill that keeps going off every October

In the first postseason matchup between the Astros and the Phillies since 1980, the Astros won the World Championship in six games, and they established themselves as one of the greatest teams of this generation if not all time.  The Phillies themselves had to run a National League gauntlet of tremendous teams to get to the Fall Classic, but miracles can happen against anyone but the 2022 Astros. One does not have to like this fact to accept it.


Enjoy the 2022 American League.

Fred Bobberts

Initial Publication Date 1/30/2023

Chandler, AZ


Saturday, January 21, 2023

Testing the Team Interception Feature in Strat-O-Matic Pro Football -Pt.2


The Second of Three parts on the Team Interception Feature in Strat-O-Matic Pro Football


Emlen Tunnell

OTHER SOM PRO FOOTBALL POSTS:

SOM PRO FOOTBALL LINKS

Okay, so I presented the Design Overview earlier. A lot of the churn about this feature is based on the view that it provides “unrealistic” or “incorrect” results.  But I think before anyone can post such a conclusion, they need to understand how to test a season accurately.  For the purposes of this discussion I am going to use the 1975 NFL Season’s team interception results.  1975 was a very challenging season to model, and since I have the original charts still on my PC can be sure this set of charts is mine. (If Mike Kane had done 1975, they might be even a better match.  But that’s neither here nor there at this point.) 

To show you how I test, I will give three variants of 1975 Interception data, for two teams:


Figure 1: Three mock tests of 1975 data

At first blush Variant 1 is way high, averaging half a yard more per interception and an extra TD.  Variant 2 is way low, with 60 less yards and one less TD.  But I’m going to argue from the perspective of this feature all three Variants are exactly the same. The interception return feature has no control over the number of interceptions it receives, team by team.  To control the number of interceptions coming into the model in a season requires many, many replays, at least sixteen and possibly thirty. In the cases above the individual distributions of each team’s interceptions are changing the results in a way that confounds the overall result. If in Variant 1 we adjust Baltimore’s results (i.e. 612 yards * 29/36) and TDs by the interceptions Baltimore should have had, then the results are exactly the same as real life.  The same is true for Variant 2, and for Cleveland, as we see below:


Figure 2: Normalized mock tests of 1975 data


There is a strong chance that the overall numbers for any given replayed season may lie to gamers, in part, if in testing you don’t control for the interceptions observed versus the actual interceptions by team. I know this can be troublesome for gamers to digest, but the purpose of this feature is to work with the interceptions it is given, and any testing approach, at least to me, needs to remove interception variance by team as a confounding effect.

(One of the most profound real-life examples of this effect is the 1961 San Diego Chargers, who picked off 49 of the AFL’s 233 interceptions and returned them for 929 Yards and 9 TDs. Those are both the NFL records, and they represent a quarter of the AFL season’s interception return yardage and half the touchdowns.  Any change in the simulated Charger interception numbers will also change the results for the AFL.  1960 Cleveland is somewhat similar in this regard, with 6 return TDs and a 20.1 yard return average. Still think this feature isn’t important to team success?)


A look at 1975

Here’s the Real Life Numbers for 1975.  Note the “House PCT” is 25/533 or 4.7 pct:


Figure 3:  Real Life Data, by Team for 1975 Interception Returns

Here’s what IRL 1975 looks like graphed. Note the size of the balloon is the TD pct:


Figure 4: Real Life 1975 Data in Graphical Form

The two most threatening teams were Baltimore, based on their number of interceptions, yards per return, and TDs, and Oakland, based purely on the number of interceptions. Comparatively speaking teams like Cincinnati and Los Angeles were very threatening in spite of middling interception counts, while Miami had close to median hands but feet of lead, and Cleveland could neither intercept well nor return well.  There’s some other interesting numbers in here, though – Houston, Pittsburgh, Minnesota and Oakland all failed to score a TD at all IRL in spite of high interceptions counts, yardage per return, or  both- all three had over 400 yards in returns but failed to score a TD.  Kansas City had 20 returns and 388 yards and also failed to score.  This is highly unusual, and I will explore that more in depth later.   

I ran six replays (my SOM PC is old and the memory small, so I am limited on what this thing can do) and here is what the results look like in raw form:


Figure 5:  Raw Interceptions and Return Data for 1975 (Six Replays)

The results are all over the board, because in this case Baltimore and Oakland underachieved with respect to interception totals, and Minnesota over achieved.  I believe this illustrates my point that you need to normalize the data to the team’s real interception total in order to draw any conclusions. So let’s do so:


 Figure 6:  Normalized Interceptions and Return Data for 1975 (Six Replays)

Once you normalize the results for the number of interceptions the teams should have had, a familiar pattern emerges. Sure, Cincinnati is a bit high, and maybe Dallas is a bit low, but it’s only six replays – 12 would be better, and 16 would be ideal.  The point is this graph bears a lot of resemblance to the Real Life graph of team Interceptions and Yards.  Here’s the chart:


Figure 7:  Normalized Interceptions and Return Data for 1975 (Six Replays) vs. Real

There’s two elephants in the room – one, the yards are lower than expected. And the TDs are higher.  Both are actually expected results, and I will explain this in painful detail in another post.  There is a reason, and I will cover it.

For my last chart, I want to present six replays of the Stock Rule.  For this rule, all teams would have the same theoretical average and same theoretical TD percentages as they use the same chart.  One would expect a straight line sloping up as interceptions increase.

Figure 8:  Normalized Interceptions and Return Data for 1975 (Six Replays) using The Old School Chart

And that’s exactly what we do see, to the limits of the fit on only six replays. Teams like the Giants, Jets and Miami are better than real life with this method.  Personally, I think the Team Chart is better at describing team relative strengths.  This Stock method also provides 42 interception TDs (normalized) versus just below 38 interception TDs by the team method, and only 25 in real life.

I’ve been – well accused might be a bit strong – but certainly charged with –ignoring interception return TDs as an overall desired outcome. Nothing could be farther from the truth.  I just understand them differently than most people.  I will cover that perspective in detail in Part 3.